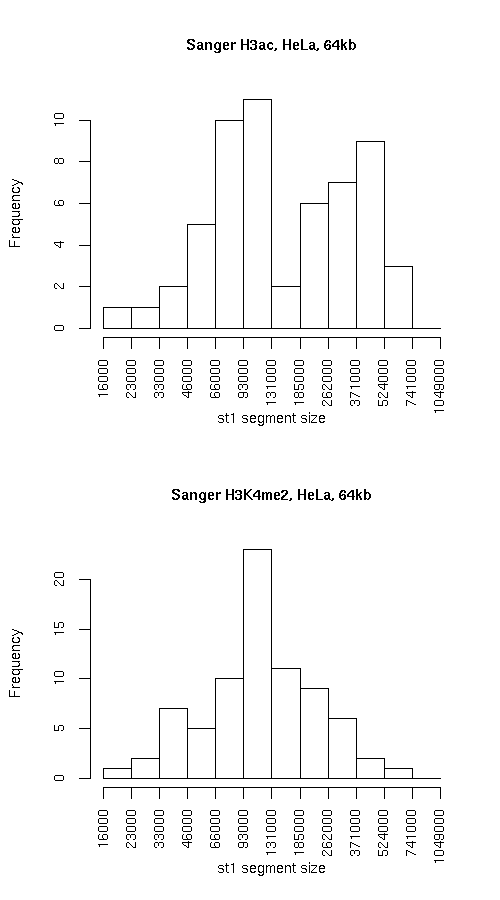
Histogram of active state (st1) segment lengths
|
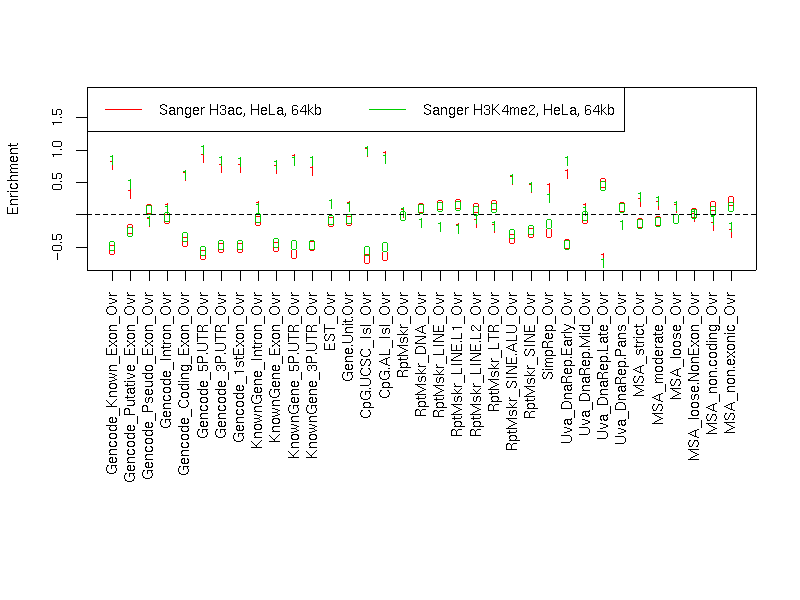
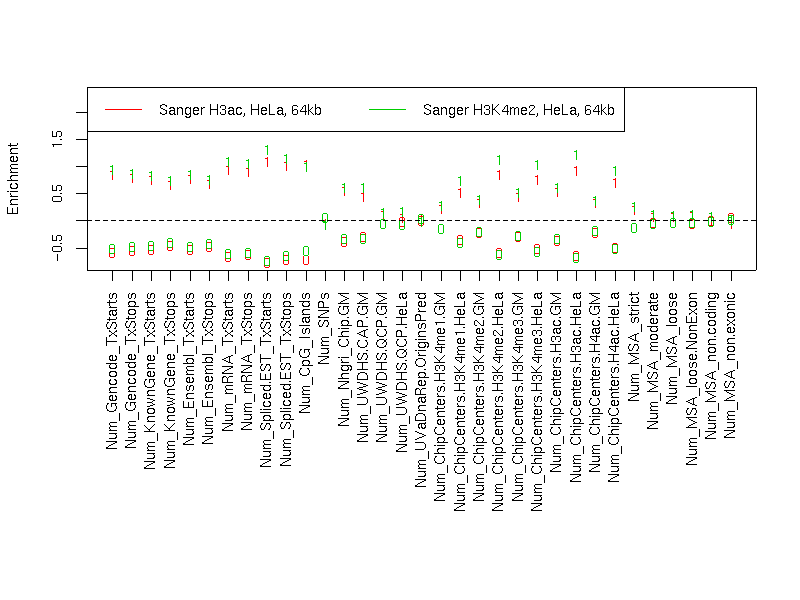
Individual segmentation statistics
| Sanger H3ac, HeLa, 64kb |
Sanger H3K4me2, HeLa, 64kb |
- Number of segments
- Total size (bp)
- State 0: 17347931
- State 1: 12509943
- Avg. segment length
- State 0: 251419
- State 1: 219473
- Median segment length
- State 0: 175999
- State 1: 127999
- Min. segment length
- State 0: 14999
- State 1: 20999
- Max. segment length
- State 0: 1036999
- State 1: 737999
|
- Number of segments
- Total size (bp)
- State 0: 18940905
- State 1: 10916923
- Avg. segment length
- State 0: 199378
- State 1: 141778
- Median segment length
- State 0: 110999
- State 1: 108999
- Min. segment length
- State 0: 6999
- State 1: 17999
- Max. segment length
- State 0: 1031999
- State 1: 629999
|
Intersection
|
st0 |
st1 |
total |
| Total bp |
16105925 |
9674933 |
25780858 |
| Fraction of SangerChip |
0.9284061 |
0.7733795 |
0.8634526 |
| Fraction of SangerChip |
0.850325 |
0.8862326 |
0.8634539 |
SangerChip minus SangerChip
|
st0 |
st1 |
total |
| Total bp |
2834980 |
1241990 |
4076970 |
| Fraction of SangerChip |
0.1634189 |
0.09928023 |
0.1365459 |
| Fraction of SangerChip |
0.149675 |
0.1137674 |
0.1365461 |
SangerChip minus SangerChip
|
st0 |
st1 |
both |
| Total bp |
2834980 |
1241990 |
4076970 |
| Fraction of SangerChip |
0.1634189 |
0.09928023 |
0.1365459 |
| Fraction of SangerChip |
0.149675 |
0.1137674 |
0.1365461 |
Symmetric difference
|
st0 |
st1 |
| Total bp |
4076986 |
4077000 |
| Fraction of SangerChip |
0.2350128 |
0.3259008 |
| Fraction of SangerChip |
0.2152477 |
0.3734569 |
|