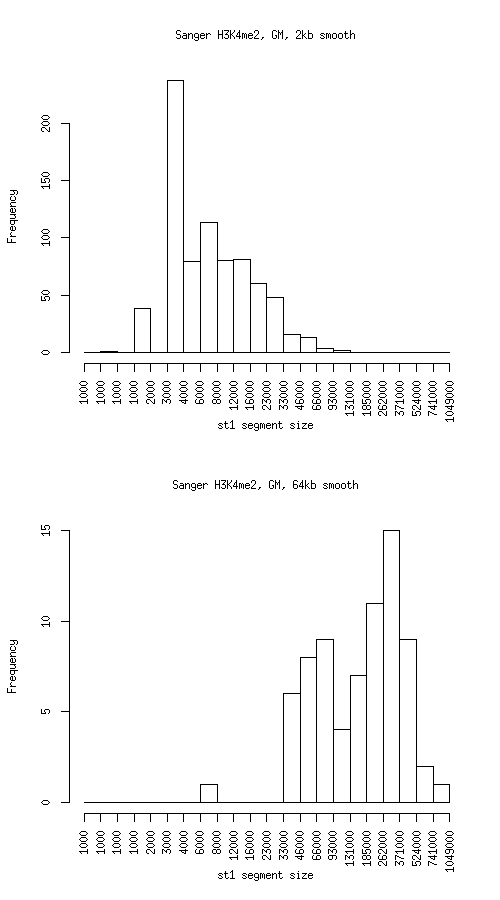
Histogram of active state (st1) segment lengths
|
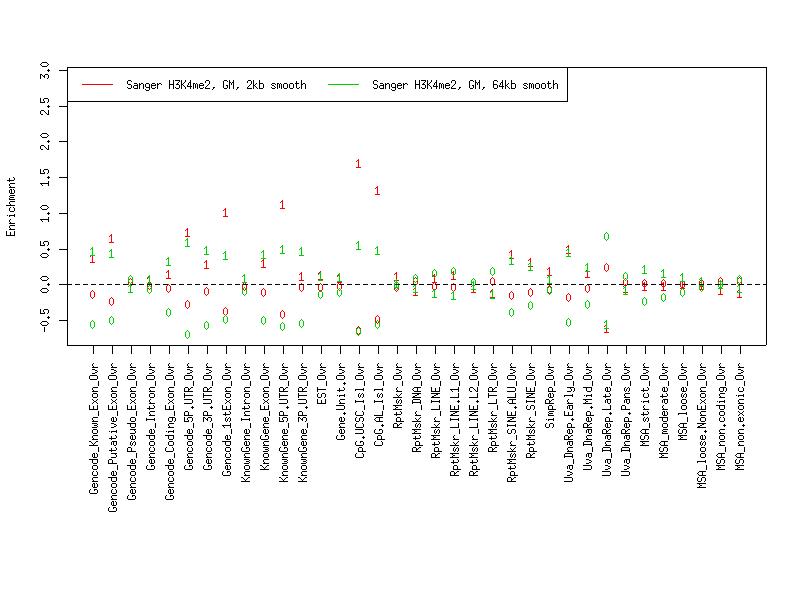
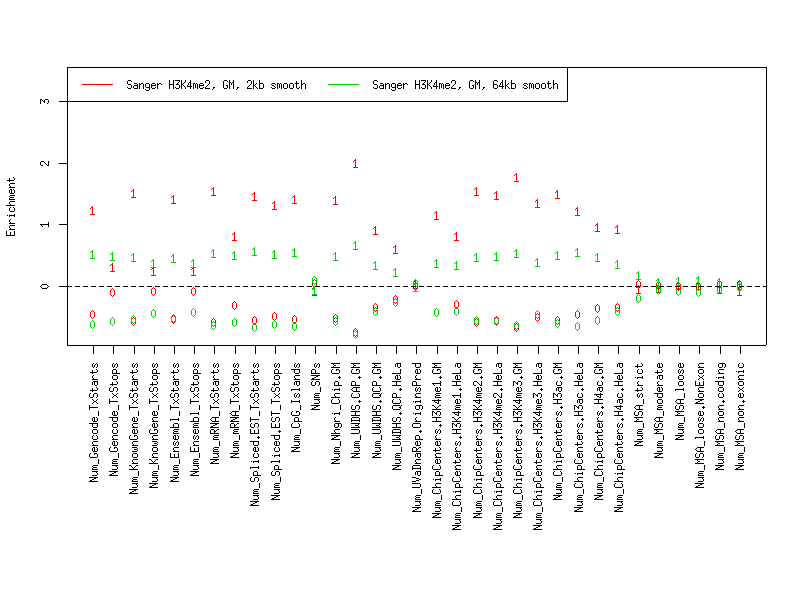
Individual segmentation statistics
| Sanger H3K4me2, GM, 2kb smooth |
Sanger H3K4me2, GM, 64kb smooth |
- Number of segments
- State 0: 801
- State 1: 771
- Total size (bp)
- State 0: 21611199
- State 1: 8224229
- Avg. segment length
- State 0: 26980
- State 1: 10667
- Median segment length
- State 0: 8999
- State 1: 5999
- Min. segment length
- State 0: 999
- State 1: 999
- Max. segment length
- State 0: 498999
- State 1: 103999
|
- Number of segments
- Total size (bp)
- State 0: 13554919
- State 1: 16281927
- Avg. segment length
- State 0: 167345
- State 1: 223040
- Median segment length
- State 0: 103999
- State 1: 203999
- Min. segment length
- State 0: 13999
- State 1: 7999
- Max. segment length
- State 0: 818999
- State 1: 944999
|
Intersection
|
st0 |
st1 |
total |
| Total bp |
13133838 |
7803311 |
20937149 |
| Fraction of smooth2000 |
0.607733 |
0.9488198 |
0.7017546 |
| Fraction of smooth64000 |
0.9689352 |
0.4792621 |
0.7017213 |
smooth2000 minus smooth64000
|
st0 |
st1 |
total |
| Total bp |
8477361 |
420918 |
8898279 |
| Fraction of smooth2000 |
0.392267 |
0.05118024 |
0.2982454 |
| Fraction of smooth64000 |
0.6254085 |
0.02585185 |
0.2982312 |
smooth64000 minus smooth2000
|
st0 |
st1 |
both |
| Total bp |
421081 |
8478616 |
8899697 |
| Fraction of smooth2000 |
0.01948439 |
1.030931 |
0.2982929 |
| Fraction of smooth64000 |
0.03106481 |
0.5207379 |
0.2982787 |
Symmetric difference
|
st0 |
st1 |
| Total bp |
8898442 |
8899534 |
| Fraction of smooth2000 |
0.4117514 |
1.082112 |
| Fraction of smooth64000 |
0.6564733 |
0.5465897 |
|