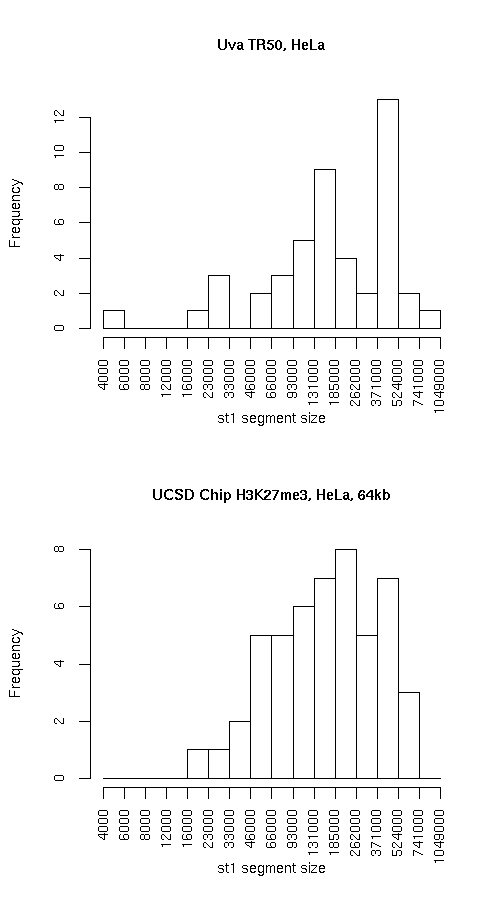
Histogram of active state (st1) segment lengths
|
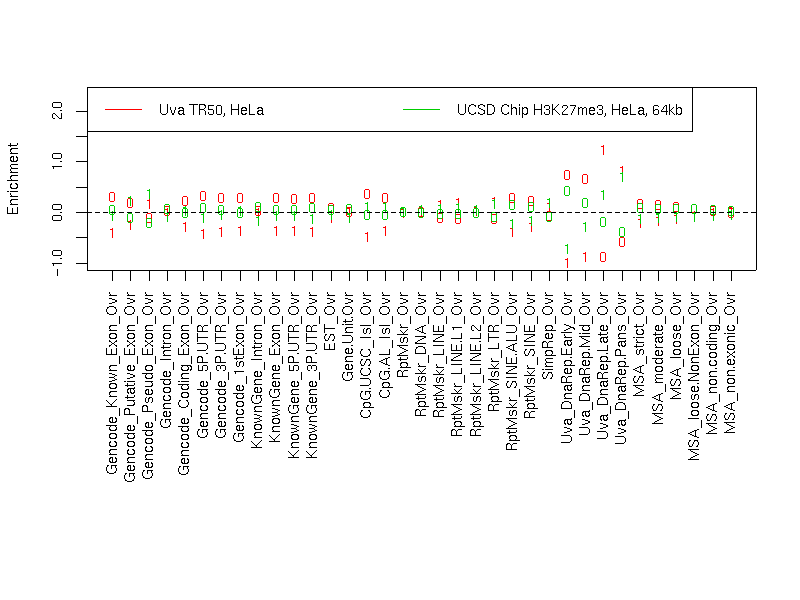
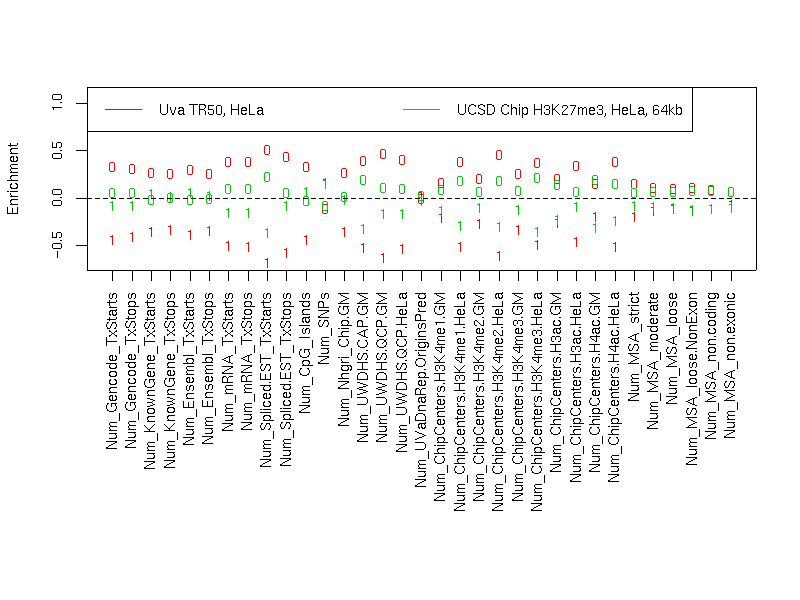
Individual segmentation statistics
| Uva TR50, HeLa |
UCSD Chip H3K27me3, HeLa, 64kb |
- Number of segments
- Total size (bp)
- State 0: 16697602
- State 1: 12152304
- Avg. segment length
- State 0: 347867
- State 1: 264181
- Median segment length
- State 0: 334499
- State 1: 180349
- Min. segment length
- State 0: 6699
- State 1: 4499
- Max. segment length
- State 0: 1617849
- State 1: 746949
|
- Number of segments
- Total size (bp)
- State 0: 18907441
- State 1: 10964950
- Avg. segment length
- State 0: 320465
- State 1: 219299
- Median segment length
- State 0: 305499
- State 1: 152249
- Min. segment length
- State 0: 16999
- State 1: 16999
- Max. segment length
- State 0: 1610499
- State 1: 661999
|
Intersection
|
st0 |
st1 |
total |
| Total bp |
13301681 |
6809998 |
20111679 |
| Fraction of UvaDnaRepTr50 |
0.7966222 |
0.5603874 |
0.6971142 |
| Fraction of UcsdChip |
0.7035157 |
0.6210697 |
0.6732531 |
UvaDnaRepTr50 minus UcsdChip
|
st0 |
st1 |
total |
| Total bp |
3395921 |
5342306 |
8738227 |
| Fraction of UvaDnaRepTr50 |
0.2033778 |
0.4396126 |
0.3028858 |
| Fraction of UcsdChip |
0.1796076 |
0.4872166 |
0.2925185 |
UcsdChip minus UvaDnaRepTr50
|
st0 |
st1 |
both |
| Total bp |
5605760 |
4154952 |
9760712 |
| Fraction of UvaDnaRepTr50 |
0.3357225 |
0.3419065 |
0.3383273 |
| Fraction of UcsdChip |
0.2964843 |
0.3789303 |
0.3267469 |
Symmetric difference
|
st0 |
st1 |
| Total bp |
9001681 |
9497258 |
| Fraction of UvaDnaRepTr50 |
0.5391002 |
0.7815191 |
| Fraction of UcsdChip |
0.476092 |
0.866147 |
|