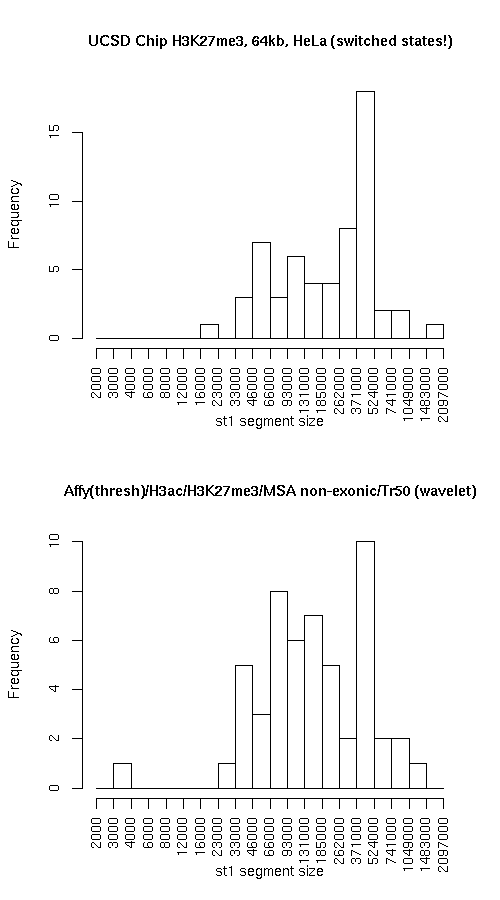
Compare segmentations, UCSD Chip H3K27me3, 64kb, HeLa (switched states!) vs. Affy(thresh)/H3ac/H3K27me3/MSA non-exonic/Tr50 (wavelet)

Histogram of active state (st1) segment lengths

Individual segmentation statistics

UCSD Chip H3K27me3, 64kb, HeLa (switched states!) Affy(thresh)/H3ac/H3K27me3/MSA non-exonic/Tr50 (wavelet)
  • Number of segments
    • State 0: 50
    • State 1: 59
  • Total size (bp)
    • State 0: 10964950
    • State 1: 18907441
  • Avg. segment length
    • State 0: 219299
    • State 1: 320465
  • Median segment length
    • State 0: 152249
    • State 1: 305499
  • Min. segment length
    • State 0: 16999
    • State 1: 16999
  • Max. segment length
    • State 0: 661999
    • State 1: 1610499
  • Number of segments
    • State 0: 61
    • State 1: 53
  • Total size (bp)
    • State 0: 16334939
    • State 1: 12922947
  • Avg. segment length
    • State 0: 267786
    • State 1: 243829
  • Median segment length
    • State 0: 175999
    • State 1: 140999
  • Min. segment length
    • State 0: 16999
    • State 1: 3999
  • Max. segment length
    • State 0: 1116999
    • State 1: 1099999

Intersection

st0 st1 total
Total bp 7861009 10311807 18172816
Fraction of UcsdChip 0.7169216 0.5453835 0.6083482
Fraction of Affy.H3ac.H3K27me3.MSA.Tr50 0.481239 0.7979455 0.6211254

UcsdChip minus Affy.H3ac.H3K27me3.MSA.Tr50

st0 st1 total
Total bp 3103941 8595634 11699575
Fraction of UcsdChip 0.2830784 0.4546165 0.3916518
Fraction of Affy.H3ac.H3K27me3.MSA.Tr50 0.1900185 0.665145 0.3998777

Affy.H3ac.H3K27me3.MSA.Tr50 minus UcsdChip

st0 st1 both
Total bp 8473930 2611140 11085070
Fraction of UcsdChip 0.7728198 0.1381012 0.3710808
Fraction of Affy.H3ac.H3K27me3.MSA.Tr50 0.518761 0.2020545 0.3788746

Symmetric difference

st0 st1
Total bp 11577871 11206774
Fraction of UcsdChip 1.055898 0.5927177
Fraction of Affy.H3ac.H3K27me3.MSA.Tr50 0.7087796 0.8671996

Enrichment of elements

Plots below indicate the relative enrichment, over the expected value, of various elements in each state, for each dataset. Enrichment values for state 0 are represented with "0"s and "1"s for state 1. Different colors are used for the different datasets.