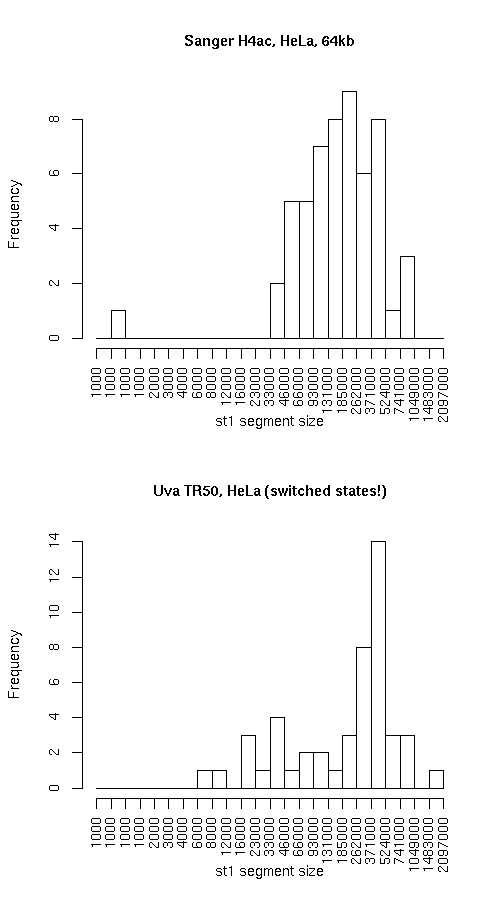
Histogram of active state (st1) segment lengths
|
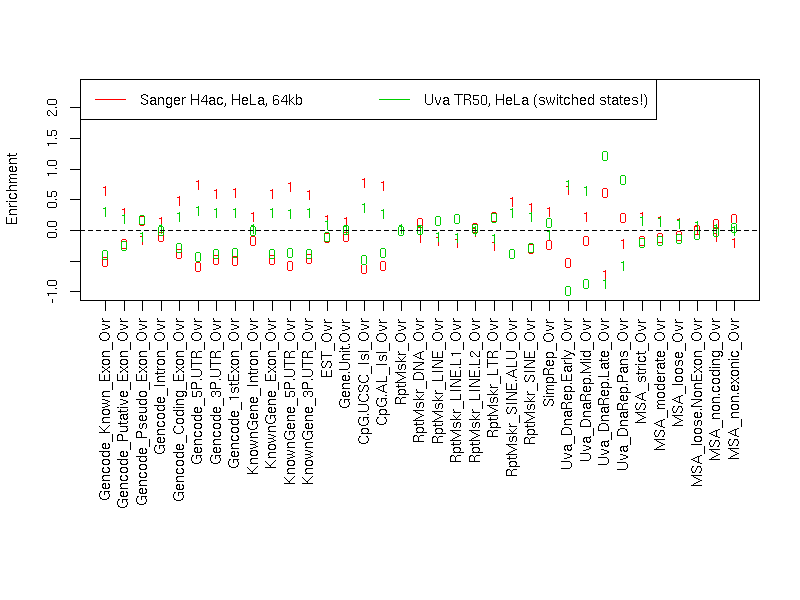
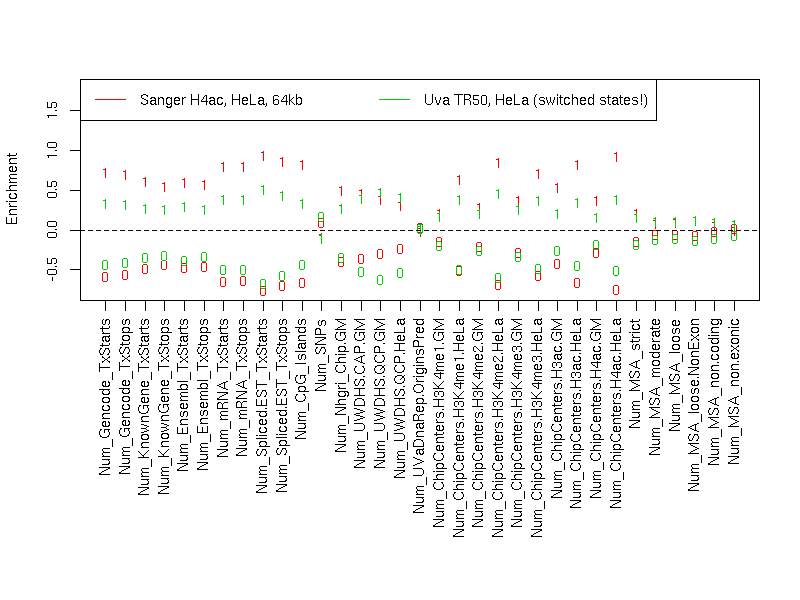
Individual segmentation statistics
| Sanger H4ac, HeLa, 64kb |
Uva TR50, HeLa (switched states!) |
- Number of segments
- Total size (bp)
- State 0: 16279939
- State 1: 13577945
- Avg. segment length
- State 0: 266884
- State 1: 246872
- Median segment length
- State 0: 183999
- State 1: 183999
- Min. segment length
- State 0: 22999
- State 1: 999
- Max. segment length
- State 0: 998999
- State 1: 899999
|
- Number of segments
- Total size (bp)
- State 0: 12152304
- State 1: 16697602
- Avg. segment length
- State 0: 264181
- State 1: 347867
- Median segment length
- State 0: 180349
- State 1: 334499
- Min. segment length
- State 0: 4499
- State 1: 6699
- Max. segment length
- State 0: 746949
- State 1: 1617849
|
Intersection
|
st0 |
st1 |
total |
| Total bp |
10477777 |
11165895 |
21643672 |
| Fraction of SangerChip |
0.6436005 |
0.8223553 |
0.7248897 |
| Fraction of UvaDnaRepTr50 |
0.862205 |
0.6687125 |
0.7502164 |
SangerChip minus UvaDnaRepTr50
|
st0 |
st1 |
total |
| Total bp |
5802162 |
2412050 |
8214212 |
| Fraction of SangerChip |
0.3563995 |
0.1776447 |
0.2751103 |
| Fraction of UvaDnaRepTr50 |
0.4774537 |
0.1444549 |
0.2847223 |
UvaDnaRepTr50 minus SangerChip
|
st0 |
st1 |
both |
| Total bp |
1674527 |
5531707 |
7206234 |
| Fraction of SangerChip |
0.1028583 |
0.4074038 |
0.2413511 |
| Fraction of UvaDnaRepTr50 |
0.1377950 |
0.3312875 |
0.2497836 |
Symmetric difference
|
st0 |
st1 |
| Total bp |
7476689 |
7943757 |
| Fraction of SangerChip |
0.4592578 |
0.5850485 |
| Fraction of UvaDnaRepTr50 |
0.6152487 |
0.4757424 |
|