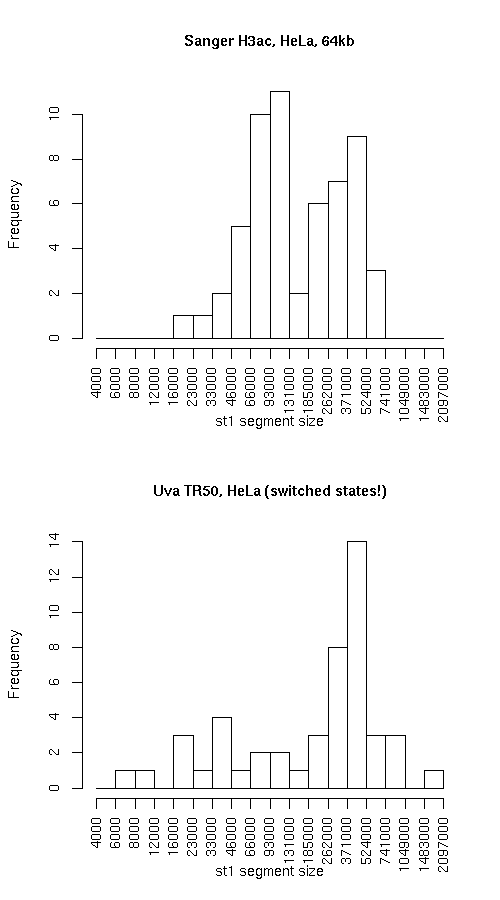
Histogram of active state (st1) segment lengths
|
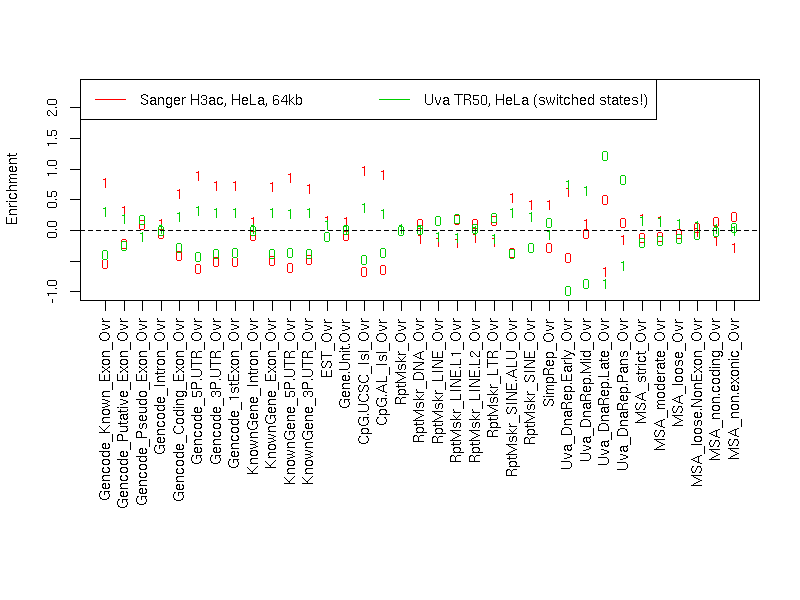
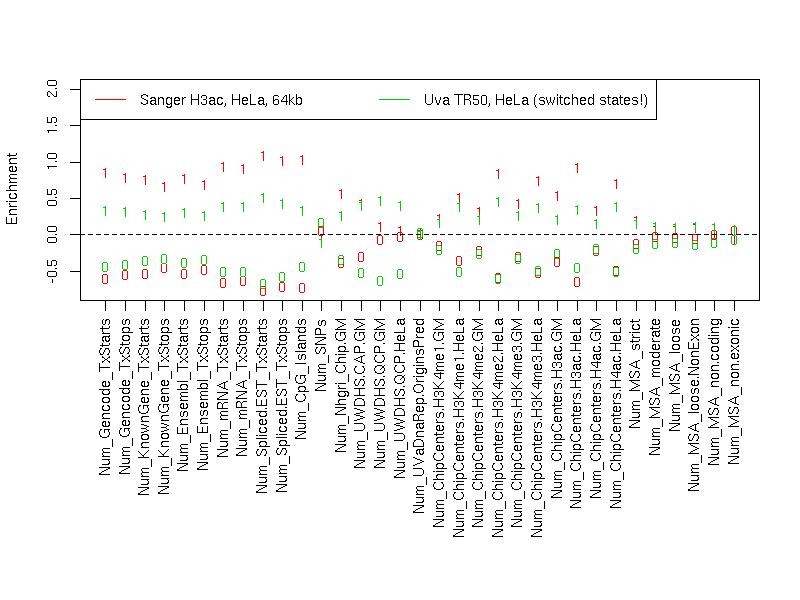
Individual segmentation statistics
| Sanger H3ac, HeLa, 64kb |
Uva TR50, HeLa (switched states!) |
- Number of segments
- Total size (bp)
- State 0: 17347931
- State 1: 12509943
- Avg. segment length
- State 0: 251419
- State 1: 219473
- Median segment length
- State 0: 175999
- State 1: 127999
- Min. segment length
- State 0: 14999
- State 1: 20999
- Max. segment length
- State 0: 1036999
- State 1: 737999
|
- Number of segments
- Total size (bp)
- State 0: 12152304
- State 1: 16697602
- Avg. segment length
- State 0: 264181
- State 1: 347867
- Median segment length
- State 0: 180349
- State 1: 334499
- Min. segment length
- State 0: 4499
- State 1: 6699
- Max. segment length
- State 0: 746949
- State 1: 1617849
|
Intersection
|
st0 |
st1 |
total |
| Total bp |
10280418 |
9903097 |
20183515 |
| Fraction of SangerChip |
0.592602 |
0.791618 |
0.6759863 |
| Fraction of UvaDnaRepTr50 |
0.8459645 |
0.593085 |
0.6996042 |
SangerChip minus UvaDnaRepTr50
|
st0 |
st1 |
total |
| Total bp |
7067513 |
2606846 |
9674359 |
| Fraction of SangerChip |
0.407398 |
0.2083819 |
0.3240137 |
| Fraction of UvaDnaRepTr50 |
0.581578 |
0.1561210 |
0.3353342 |
UvaDnaRepTr50 minus SangerChip
|
st0 |
st1 |
both |
| Total bp |
1871886 |
6794505 |
8666391 |
| Fraction of SangerChip |
0.1079026 |
0.5431284 |
0.2902548 |
| Fraction of UvaDnaRepTr50 |
0.1540355 |
0.406915 |
0.3003958 |
Symmetric difference
|
st0 |
st1 |
| Total bp |
8939399 |
9401351 |
| Fraction of SangerChip |
0.5153006 |
0.7515103 |
| Fraction of UvaDnaRepTr50 |
0.7356135 |
0.563036 |
|