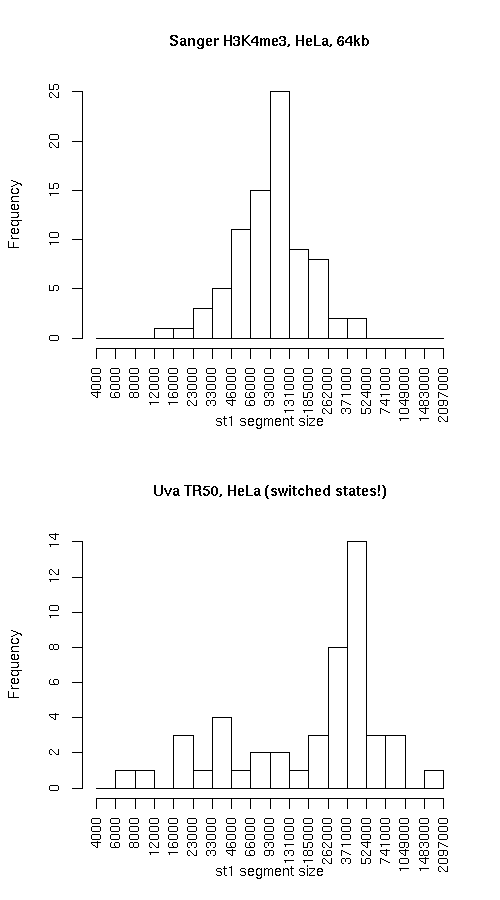
Histogram of active state (st1) segment lengths
|
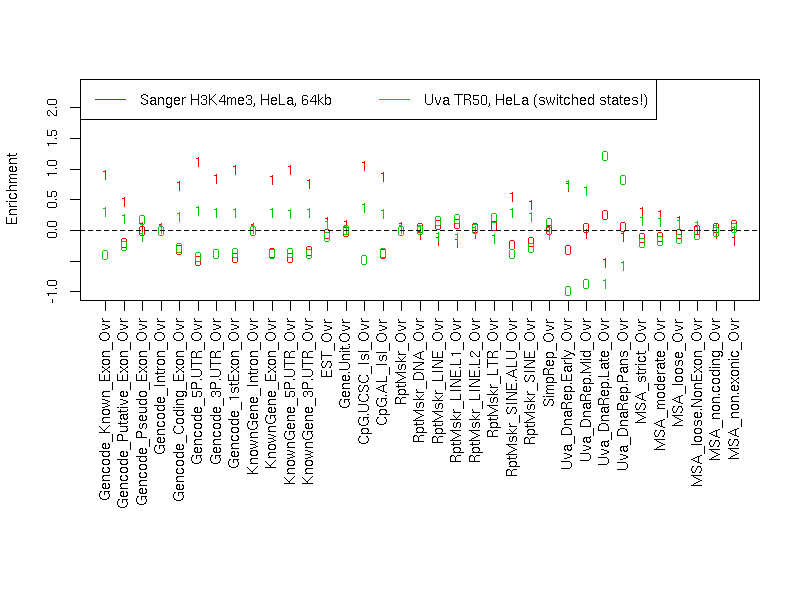
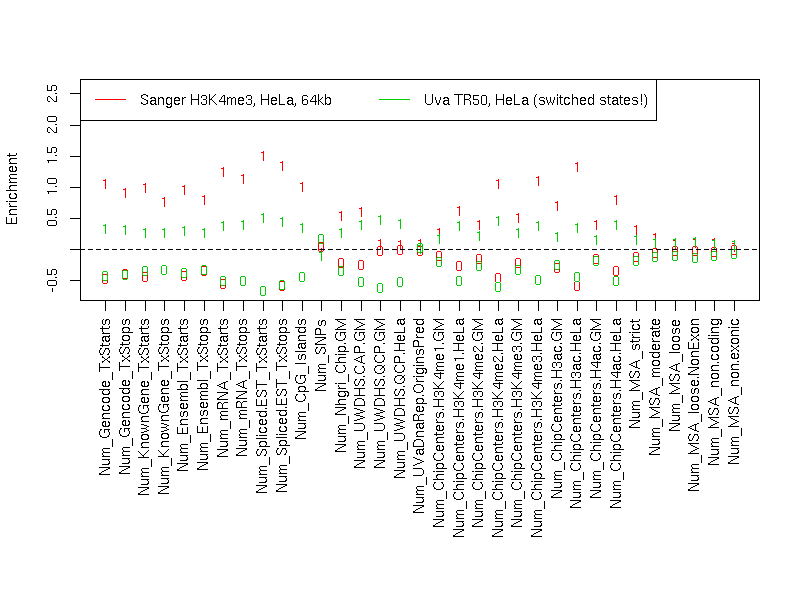
Individual segmentation statistics
| Sanger H3K4me3, HeLa, 64kb |
Uva TR50, HeLa (switched states!) |
- Number of segments
- Total size (bp)
- State 0: 20489899
- State 1: 9367918
- Avg. segment length
- State 0: 202870
- State 1: 114243
- Median segment length
- State 0: 122999
- State 1: 99999
- Min. segment length
- State 0: 8999
- State 1: 13999
- Max. segment length
- State 0: 1038999
- State 1: 423999
|
- Number of segments
- Total size (bp)
- State 0: 12152304
- State 1: 16697602
- Avg. segment length
- State 0: 264181
- State 1: 347867
- Median segment length
- State 0: 180349
- State 1: 334499
- Min. segment length
- State 0: 4499
- State 1: 6699
- Max. segment length
- State 0: 746949
- State 1: 1617849
|
Intersection
|
st0 |
st1 |
total |
| Total bp |
10239983 |
7208197 |
17448180 |
| Fraction of SangerChip |
0.4997576 |
0.7694556 |
0.5843756 |
| Fraction of UvaDnaRepTr50 |
0.8426372 |
0.4316906 |
0.6047916 |
SangerChip minus UvaDnaRepTr50
|
st0 |
st1 |
total |
| Total bp |
10249916 |
2159721 |
12409637 |
| Fraction of SangerChip |
0.5002424 |
0.2305444 |
0.4156244 |
| Fraction of UvaDnaRepTr50 |
0.8434545 |
0.1293432 |
0.4301448 |
UvaDnaRepTr50 minus SangerChip
|
st0 |
st1 |
both |
| Total bp |
1912321 |
9489405 |
11401726 |
| Fraction of SangerChip |
0.09332994 |
1.012968 |
0.3818674 |
| Fraction of UvaDnaRepTr50 |
0.1573628 |
0.5683094 |
0.3952084 |
Symmetric difference
|
st0 |
st1 |
| Total bp |
12162237 |
11649126 |
| Fraction of SangerChip |
0.5935723 |
1.243513 |
| Fraction of UvaDnaRepTr50 |
1.000817 |
0.6976526 |
|