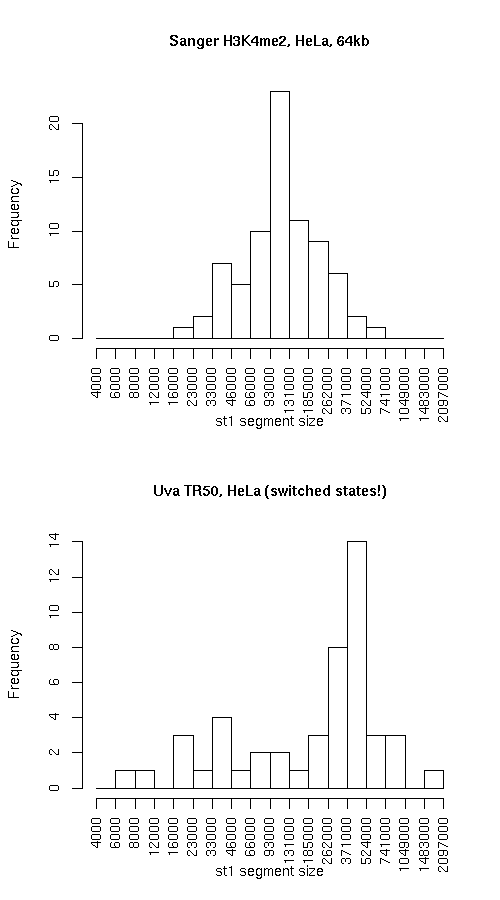
Histogram of active state (st1) segment lengths
|
Individual segmentation statistics
| Sanger H3K4me2, HeLa, 64kb |
Uva TR50, HeLa (switched states!) |
- Number of segments
- Total size (bp)
- State 0: 18940905
- State 1: 10916923
- Avg. segment length
- State 0: 199378
- State 1: 141778
- Median segment length
- State 0: 110999
- State 1: 108999
- Min. segment length
- State 0: 6999
- State 1: 17999
- Max. segment length
- State 0: 1031999
- State 1: 629999
|
- Number of segments
- Total size (bp)
- State 0: 12152304
- State 1: 16697602
- Avg. segment length
- State 0: 264181
- State 1: 347867
- Median segment length
- State 0: 180349
- State 1: 334499
- Min. segment length
- State 0: 4499
- State 1: 6699
- Max. segment length
- State 0: 746949
- State 1: 1617849
|
Intersection
|
st0 |
st1 |
total |
| Total bp |
10771252 |
9109479 |
19880731 |
| Fraction of SangerChip |
0.5686767 |
0.8344365 |
0.6658465 |
| Fraction of UvaDnaRepTr50 |
0.8863547 |
0.5455561 |
0.689109 |
SangerChip minus UvaDnaRepTr50
|
st0 |
st1 |
total |
| Total bp |
8169653 |
1807444 |
9977097 |
| Fraction of SangerChip |
0.4313233 |
0.1655635 |
0.3341535 |
| Fraction of UvaDnaRepTr50 |
0.672272 |
0.1082457 |
0.3458277 |
UvaDnaRepTr50 minus SangerChip
|
st0 |
st1 |
both |
| Total bp |
1381052 |
7588123 |
8969175 |
| Fraction of SangerChip |
0.07291373 |
0.6950789 |
0.3003961 |
| Fraction of UvaDnaRepTr50 |
0.1136453 |
0.4544439 |
0.3108910 |
Symmetric difference
|
st0 |
st1 |
| Total bp |
9550705 |
9395567 |
| Fraction of SangerChip |
0.504237 |
0.8606424 |
| Fraction of UvaDnaRepTr50 |
0.7859172 |
0.5626896 |
|