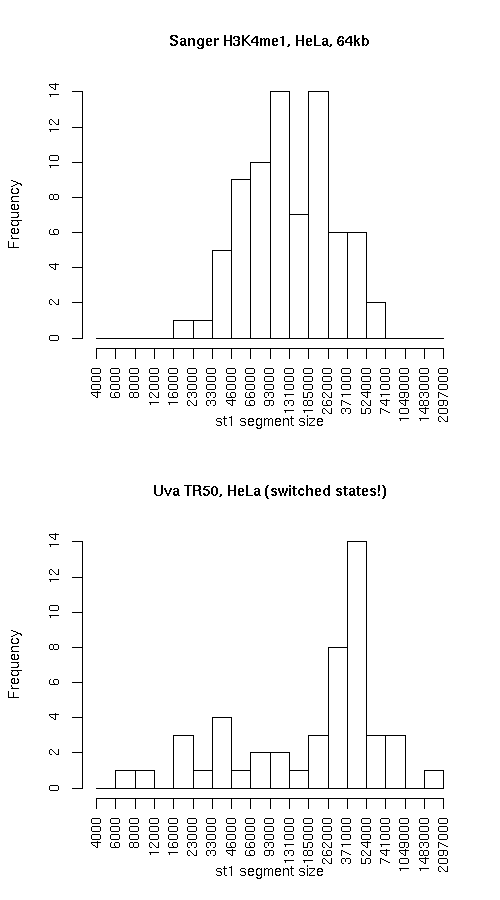
Histogram of active state (st1) segment lengths
|
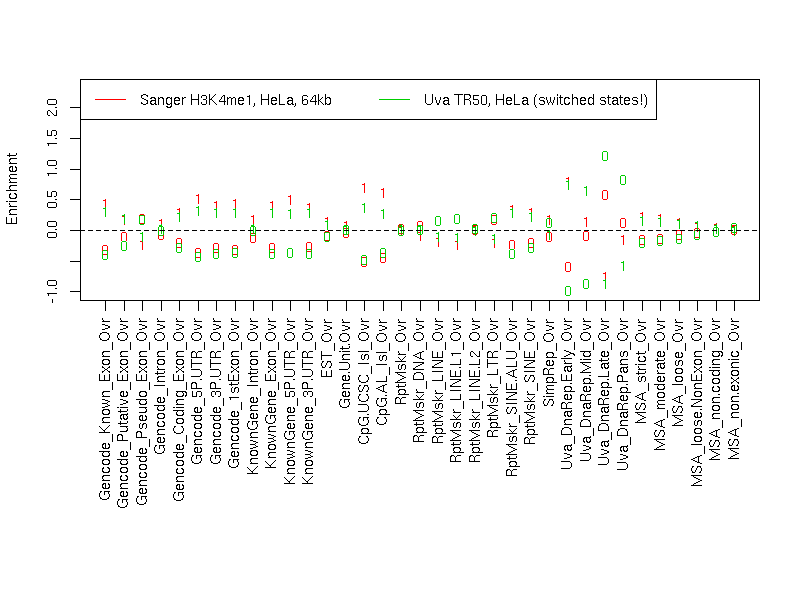
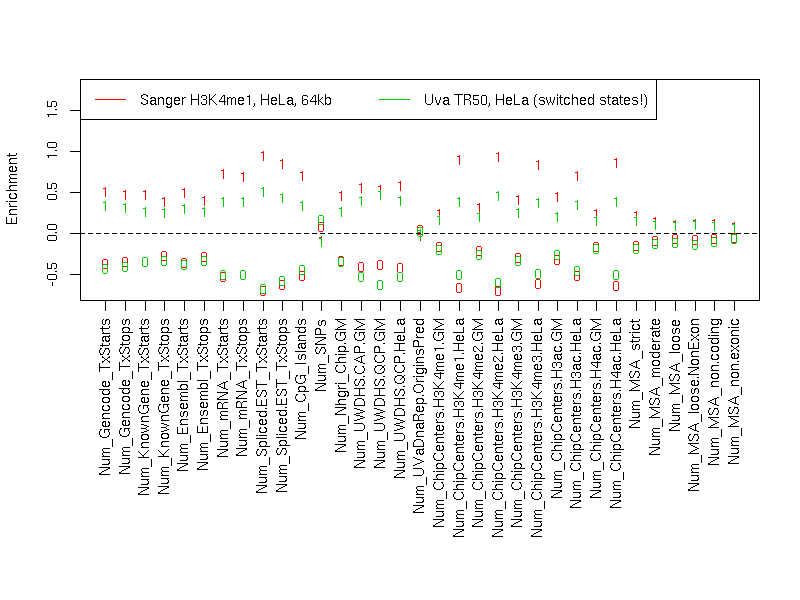
Individual segmentation statistics
| Sanger H3K4me1, HeLa, 64kb |
Uva TR50, HeLa (switched states!) |
- Number of segments
- Total size (bp)
- State 0: 17014912
- State 1: 12842925
- Avg. segment length
- State 0: 193351
- State 1: 171239
- Median segment length
- State 0: 118499
- State 1: 125999
- Min. segment length
- State 0: 16999
- State 1: 18999
- Max. segment length
- State 0: 998999
- State 1: 575999
|
- Number of segments
- Total size (bp)
- State 0: 12152304
- State 1: 16697602
- Avg. segment length
- State 0: 264181
- State 1: 347867
- Median segment length
- State 0: 180349
- State 1: 334499
- Min. segment length
- State 0: 4499
- State 1: 6699
- Max. segment length
- State 0: 746949
- State 1: 1617849
|
Intersection
|
st0 |
st1 |
total |
| Total bp |
10562326 |
10687104 |
21249430 |
| Fraction of SangerChip |
0.6207688 |
0.8321394 |
0.7116869 |
| Fraction of UvaDnaRepTr50 |
0.8691624 |
0.6400383 |
0.7365511 |
SangerChip minus UvaDnaRepTr50
|
st0 |
st1 |
total |
| Total bp |
6452586 |
2155821 |
8608407 |
| Fraction of SangerChip |
0.3792312 |
0.1678606 |
0.2883131 |
| Fraction of UvaDnaRepTr50 |
0.5309763 |
0.1291096 |
0.2983860 |
UvaDnaRepTr50 minus SangerChip
|
st0 |
st1 |
both |
| Total bp |
1589978 |
6010498 |
7600476 |
| Fraction of SangerChip |
0.09344615 |
0.4680007 |
0.2545555 |
| Fraction of UvaDnaRepTr50 |
0.1308376 |
0.3599617 |
0.2634489 |
Symmetric difference
|
st0 |
st1 |
| Total bp |
8042564 |
8166319 |
| Fraction of SangerChip |
0.4726774 |
0.6358613 |
| Fraction of UvaDnaRepTr50 |
0.6618139 |
0.4890714 |
|