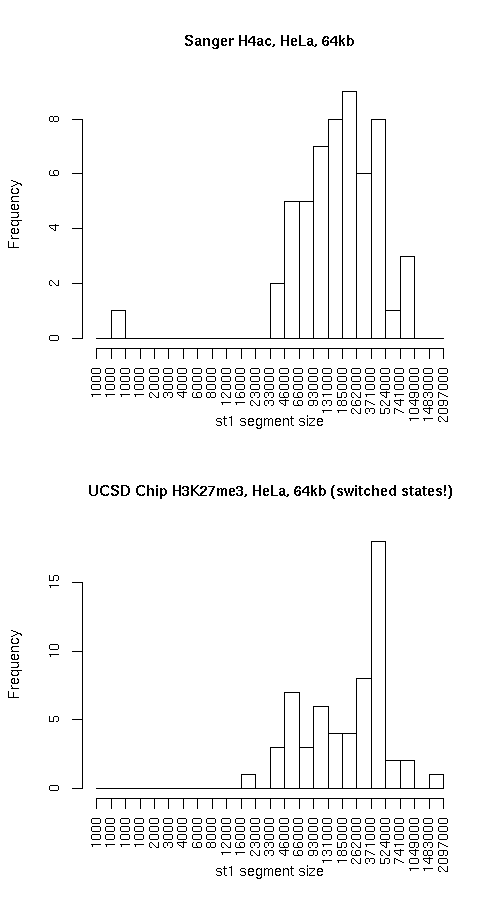
Histogram of active state (st1) segment lengths
|
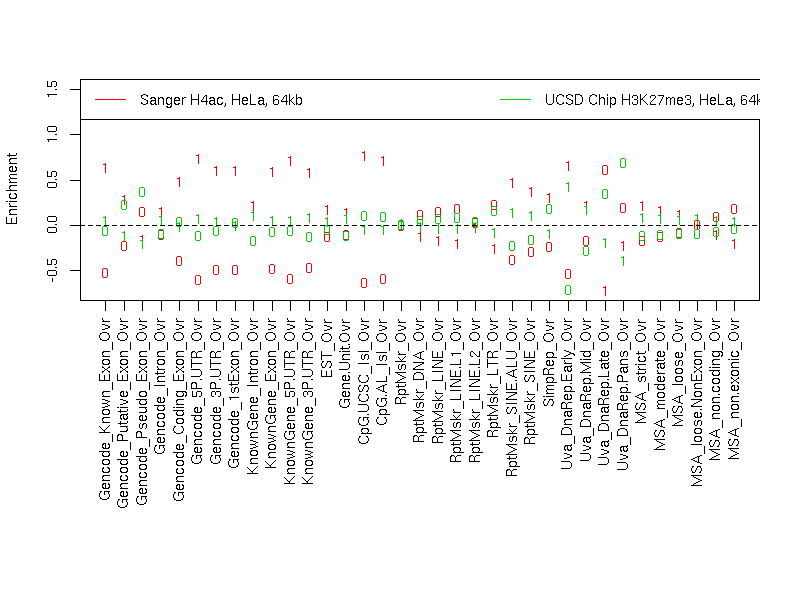
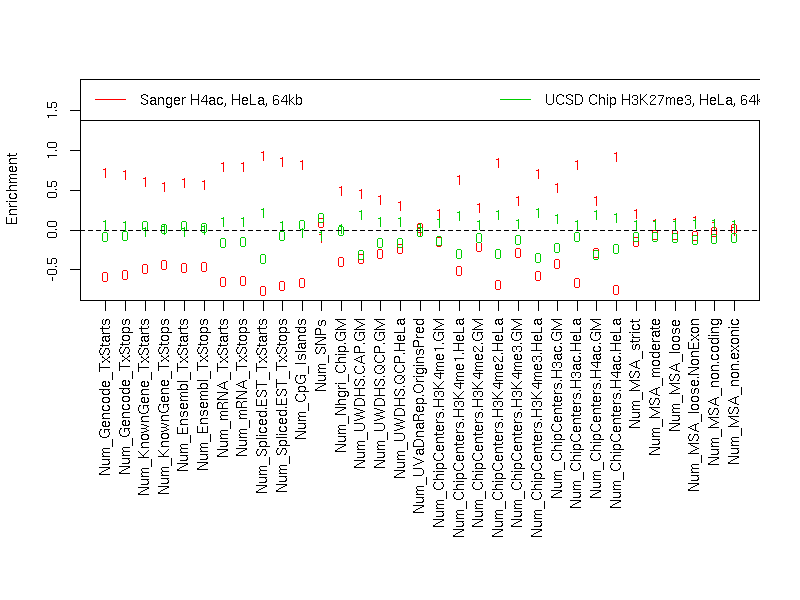
Individual segmentation statistics
| Sanger H4ac, HeLa, 64kb |
UCSD Chip H3K27me3, HeLa, 64kb (switched states!) |
- Number of segments
- Total size (bp)
- State 0: 16279939
- State 1: 13577945
- Avg. segment length
- State 0: 266884
- State 1: 246872
- Median segment length
- State 0: 183999
- State 1: 183999
- Min. segment length
- State 0: 22999
- State 1: 999
- Max. segment length
- State 0: 998999
- State 1: 899999
|
- Number of segments
- Total size (bp)
- State 0: 10964950
- State 1: 18907441
- Avg. segment length
- State 0: 219299
- State 1: 320465
- Median segment length
- State 0: 152249
- State 1: 305499
- Min. segment length
- State 0: 16999
- State 1: 16999
- Max. segment length
- State 0: 661999
- State 1: 1610499
|
Intersection
|
st0 |
st1 |
total |
| Total bp |
8056012 |
10671320 |
18727332 |
| Fraction of SangerChip |
0.4948429 |
0.7859304 |
0.6272156 |
| Fraction of UcsdChip |
0.7347058 |
0.5643979 |
0.626911 |
SangerChip minus UcsdChip
|
st0 |
st1 |
total |
| Total bp |
8223927 |
2906625 |
11130552 |
| Fraction of SangerChip |
0.5051571 |
0.2140696 |
0.3727844 |
| Fraction of UcsdChip |
0.7500196 |
0.1537292 |
0.3726033 |
UcsdChip minus SangerChip
|
st0 |
st1 |
both |
| Total bp |
2908938 |
8236121 |
11145059 |
| Fraction of SangerChip |
0.1786824 |
0.6065808 |
0.3732702 |
| Fraction of UcsdChip |
0.2652942 |
0.4356021 |
0.3730890 |
Symmetric difference
|
st0 |
st1 |
| Total bp |
11132865 |
11142746 |
| Fraction of SangerChip |
0.6838395 |
0.8206504 |
| Fraction of UcsdChip |
1.015314 |
0.5893313 |
|