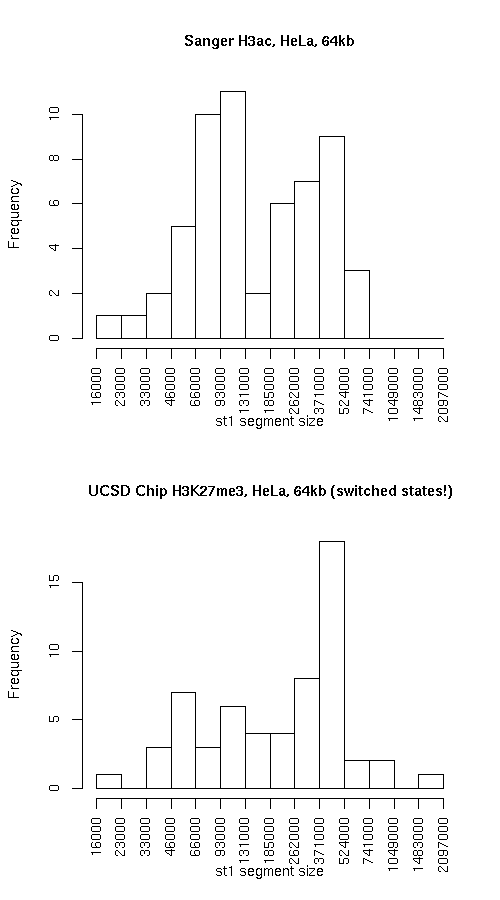
Histogram of active state (st1) segment lengths
|
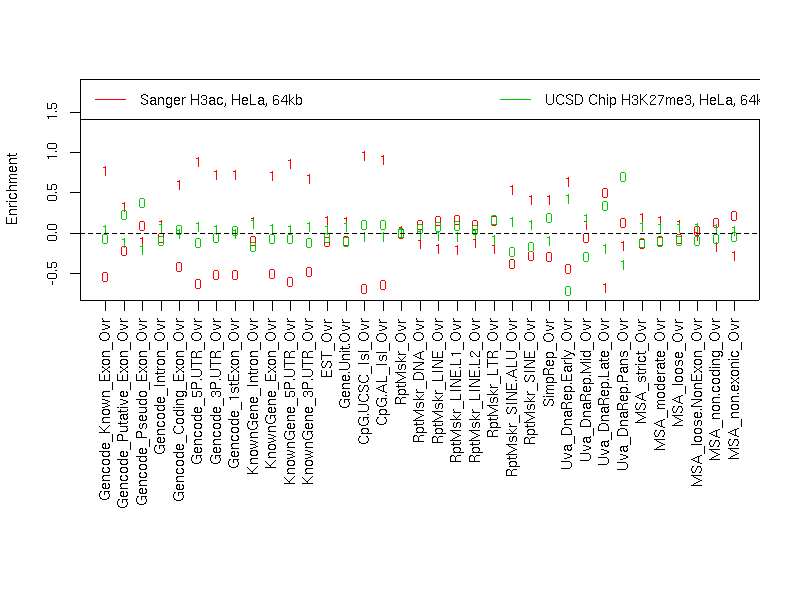
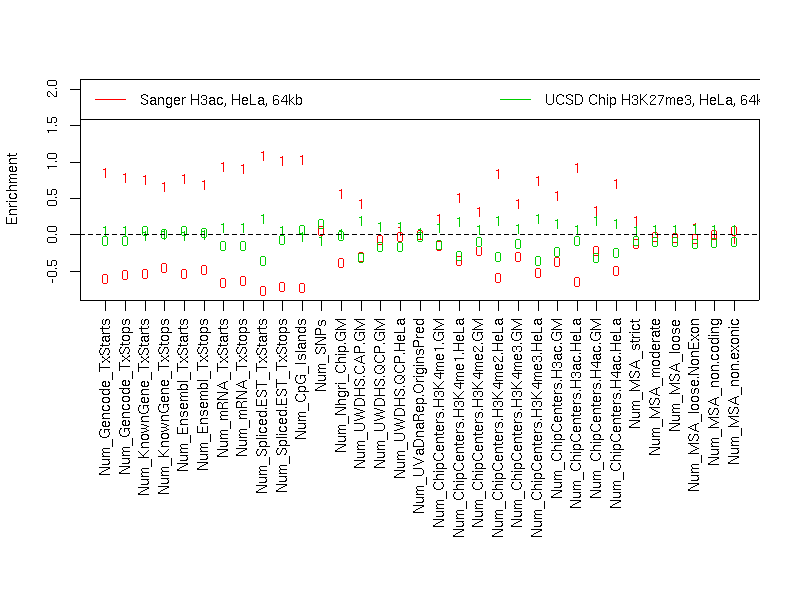
Individual segmentation statistics
| Sanger H3ac, HeLa, 64kb |
UCSD Chip H3K27me3, HeLa, 64kb (switched states!) |
- Number of segments
- Total size (bp)
- State 0: 17347931
- State 1: 12509943
- Avg. segment length
- State 0: 251419
- State 1: 219473
- Median segment length
- State 0: 175999
- State 1: 127999
- Min. segment length
- State 0: 14999
- State 1: 20999
- Max. segment length
- State 0: 1036999
- State 1: 737999
|
- Number of segments
- Total size (bp)
- State 0: 10964950
- State 1: 18907441
- Avg. segment length
- State 0: 219299
- State 1: 320465
- Median segment length
- State 0: 152249
- State 1: 305499
- Min. segment length
- State 0: 16999
- State 1: 16999
- Max. segment length
- State 0: 661999
- State 1: 1610499
|
Intersection
|
st0 |
st1 |
total |
| Total bp |
7982893 |
9530726 |
17513619 |
| Fraction of SangerChip |
0.460164 |
0.761852 |
0.5865662 |
| Fraction of UcsdChip |
0.7280373 |
0.5040728 |
0.5862811 |
SangerChip minus UcsdChip
|
st0 |
st1 |
total |
| Total bp |
9365038 |
2979217 |
12344255 |
| Fraction of SangerChip |
0.539836 |
0.2381479 |
0.4134338 |
| Fraction of UcsdChip |
0.8540885 |
0.1575685 |
0.4132329 |
UcsdChip minus SangerChip
|
st0 |
st1 |
both |
| Total bp |
2982057 |
9376715 |
12358772 |
| Fraction of SangerChip |
0.171897 |
0.749541 |
0.41392 |
| Fraction of UcsdChip |
0.2719627 |
0.4959272 |
0.4137189 |
Symmetric difference
|
st0 |
st1 |
| Total bp |
12347095 |
12355932 |
| Fraction of SangerChip |
0.711733 |
0.987689 |
| Fraction of UcsdChip |
1.126051 |
0.6534957 |
|