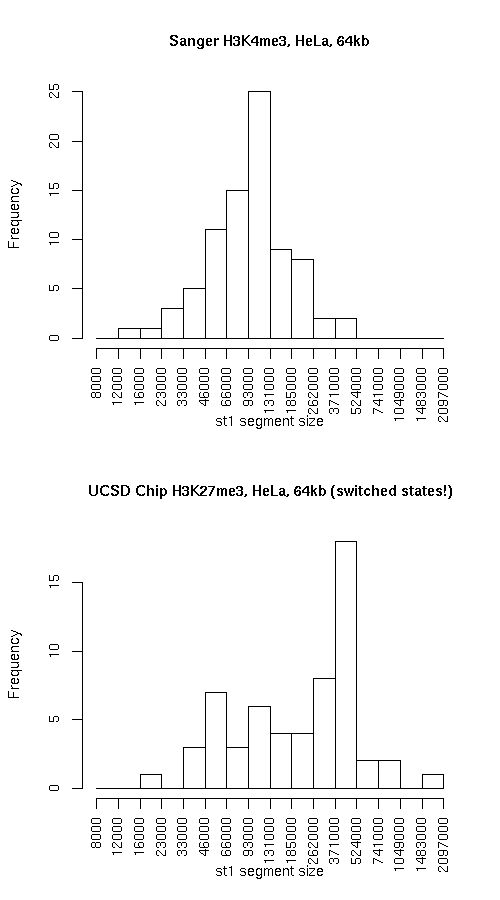
Histogram of active state (st1) segment lengths
|
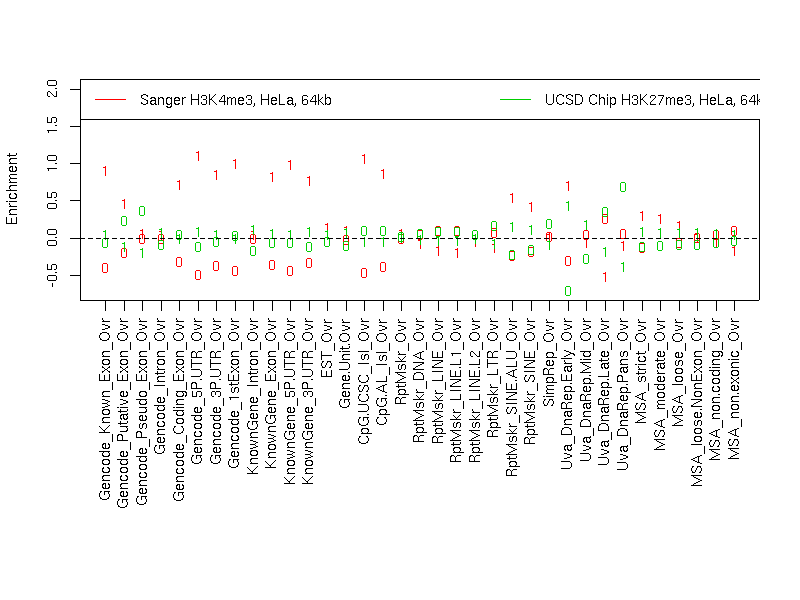
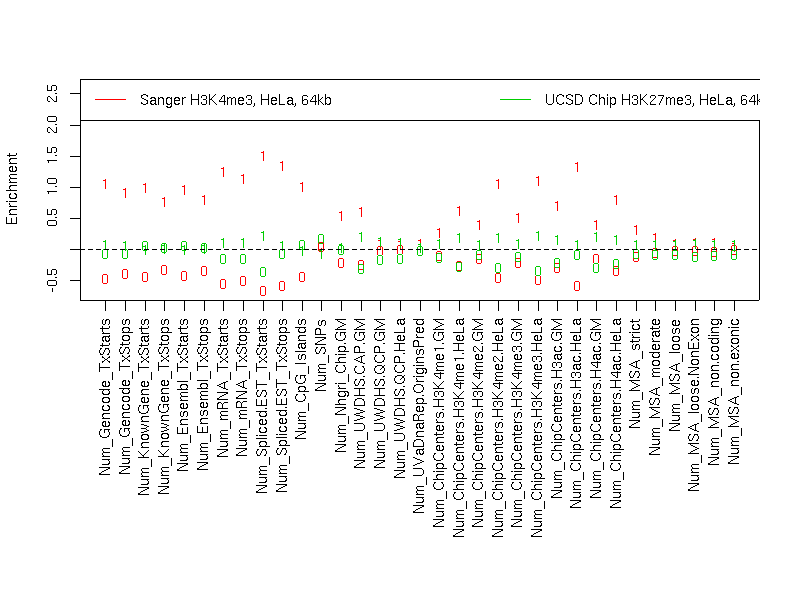
Individual segmentation statistics
| Sanger H3K4me3, HeLa, 64kb |
UCSD Chip H3K27me3, HeLa, 64kb (switched states!) |
- Number of segments
- Total size (bp)
- State 0: 20489899
- State 1: 9367918
- Avg. segment length
- State 0: 202870
- State 1: 114243
- Median segment length
- State 0: 122999
- State 1: 99999
- Min. segment length
- State 0: 8999
- State 1: 13999
- Max. segment length
- State 0: 1038999
- State 1: 423999
|
- Number of segments
- Total size (bp)
- State 0: 10964950
- State 1: 18907441
- Avg. segment length
- State 0: 219299
- State 1: 320465
- Median segment length
- State 0: 152249
- State 1: 305499
- Min. segment length
- State 0: 16999
- State 1: 16999
- Max. segment length
- State 0: 661999
- State 1: 1610499
|
Intersection
|
st0 |
st1 |
total |
| Total bp |
8601763 |
7014406 |
15616169 |
| Fraction of SangerChip |
0.4198050 |
0.748769 |
0.5230178 |
| Fraction of UcsdChip |
0.7844781 |
0.3709865 |
0.5227626 |
SangerChip minus UcsdChip
|
st0 |
st1 |
total |
| Total bp |
11888136 |
2353512 |
14241648 |
| Fraction of SangerChip |
0.580195 |
0.2512311 |
0.4769822 |
| Fraction of UcsdChip |
1.084194 |
0.1244754 |
0.4767495 |
UcsdChip minus SangerChip
|
st0 |
st1 |
both |
| Total bp |
2363187 |
11893035 |
14256222 |
| Fraction of SangerChip |
0.1153342 |
1.269549 |
0.4774703 |
| Fraction of UcsdChip |
0.2155219 |
0.6290135 |
0.4772374 |
Symmetric difference
|
st0 |
st1 |
| Total bp |
14251323 |
14246547 |
| Fraction of SangerChip |
0.6955292 |
1.520780 |
| Fraction of UcsdChip |
1.299716 |
0.7534889 |
|