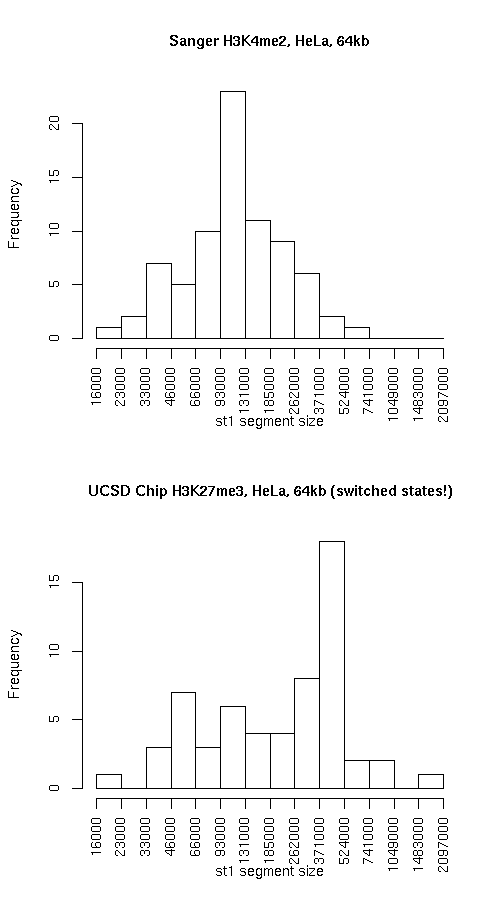
Histogram of active state (st1) segment lengths
|
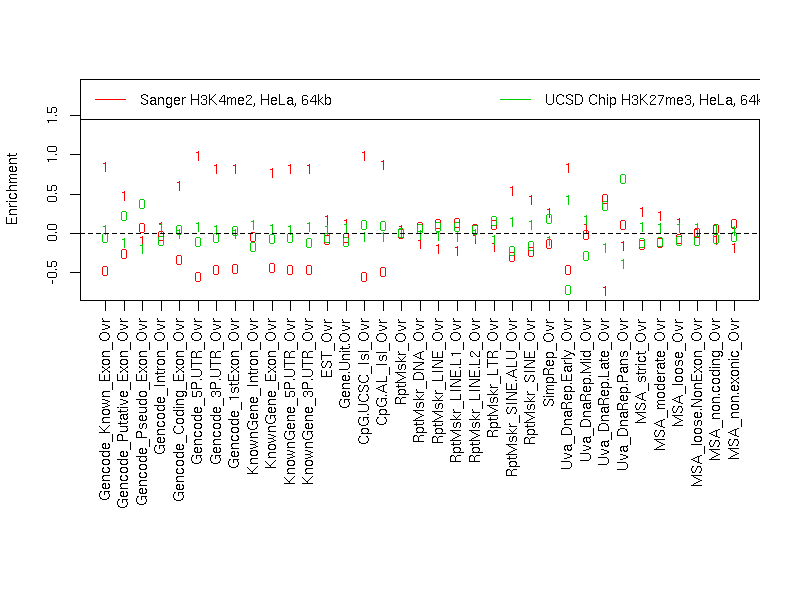
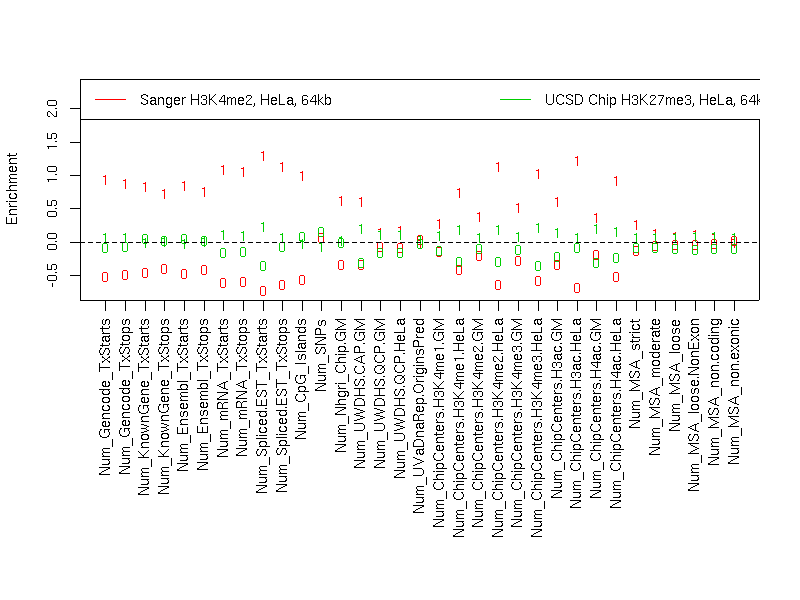
Individual segmentation statistics
| Sanger H3K4me2, HeLa, 64kb |
UCSD Chip H3K27me3, HeLa, 64kb (switched states!) |
- Number of segments
- Total size (bp)
- State 0: 18940905
- State 1: 10916923
- Avg. segment length
- State 0: 199378
- State 1: 141778
- Median segment length
- State 0: 110999
- State 1: 108999
- Min. segment length
- State 0: 6999
- State 1: 17999
- Max. segment length
- State 0: 1031999
- State 1: 629999
|
- Number of segments
- Total size (bp)
- State 0: 10964950
- State 1: 18907441
- Avg. segment length
- State 0: 219299
- State 1: 320465
- Median segment length
- State 0: 152249
- State 1: 305499
- Min. segment length
- State 0: 16999
- State 1: 16999
- Max. segment length
- State 0: 661999
- State 1: 1610499
|
Intersection
|
st0 |
st1 |
total |
| Total bp |
8172310 |
8133590 |
16305900 |
| Fraction of SangerChip |
0.4314635 |
0.7450442 |
0.5461181 |
| Fraction of UcsdChip |
0.7453121 |
0.4301793 |
0.5458519 |
SangerChip minus UcsdChip
|
st0 |
st1 |
total |
| Total bp |
10768595 |
2783333 |
13551928 |
| Fraction of SangerChip |
0.5685365 |
0.2549558 |
0.4538819 |
| Fraction of UcsdChip |
0.9820925 |
0.1472083 |
0.4536606 |
UcsdChip minus SangerChip
|
st0 |
st1 |
both |
| Total bp |
2792640 |
10773851 |
13566491 |
| Fraction of SangerChip |
0.1474396 |
0.9868945 |
0.4543697 |
| Fraction of UcsdChip |
0.2546879 |
0.5698207 |
0.4541481 |
Symmetric difference
|
st0 |
st1 |
| Total bp |
13561235 |
13557184 |
| Fraction of SangerChip |
0.7159761 |
1.241850 |
| Fraction of UcsdChip |
1.236780 |
0.717029 |
|