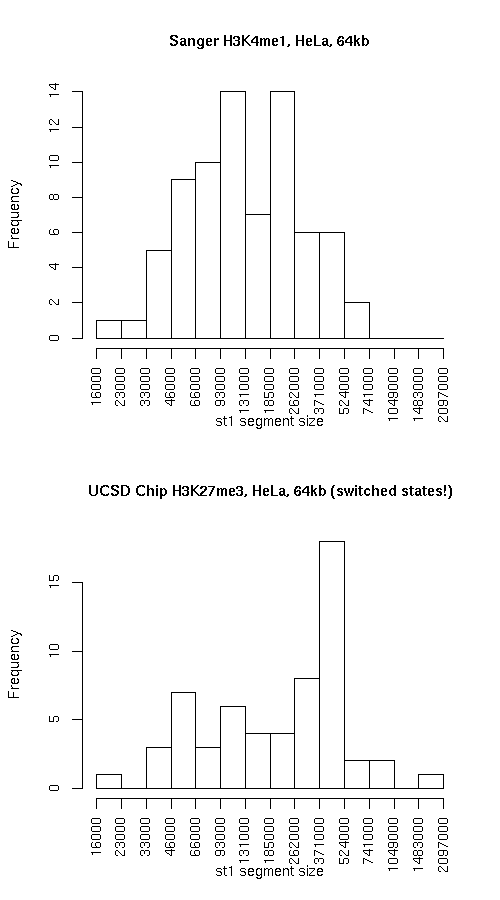
Histogram of active state (st1) segment lengths
|
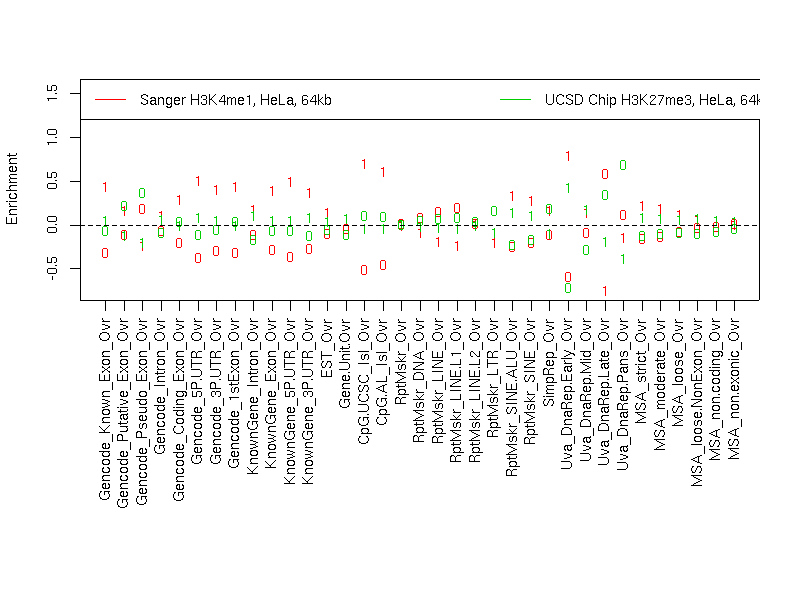
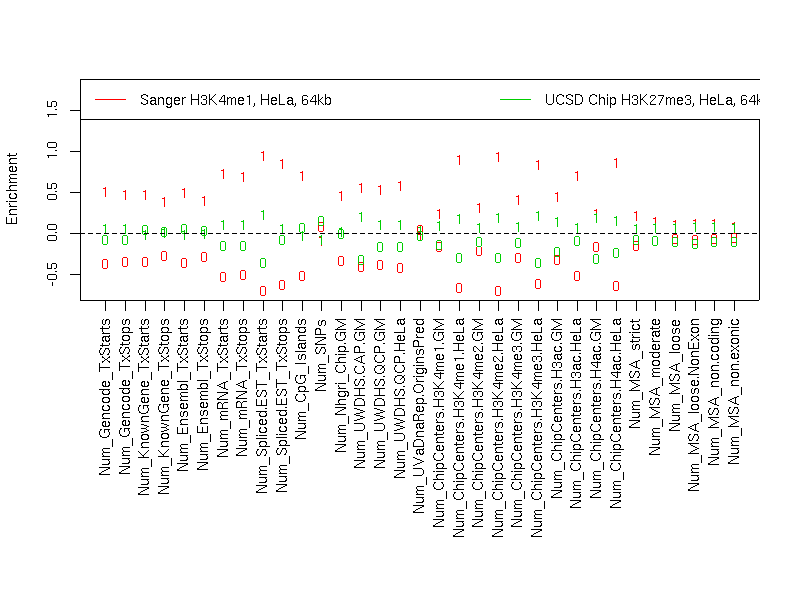
Individual segmentation statistics
| Sanger H3K4me1, HeLa, 64kb |
UCSD Chip H3K27me3, HeLa, 64kb (switched states!) |
- Number of segments
- Total size (bp)
- State 0: 17014912
- State 1: 12842925
- Avg. segment length
- State 0: 193351
- State 1: 171239
- Median segment length
- State 0: 118499
- State 1: 125999
- Min. segment length
- State 0: 16999
- State 1: 18999
- Max. segment length
- State 0: 998999
- State 1: 575999
|
- Number of segments
- Total size (bp)
- State 0: 10964950
- State 1: 18907441
- Avg. segment length
- State 0: 219299
- State 1: 320465
- Median segment length
- State 0: 152249
- State 1: 305499
- Min. segment length
- State 0: 16999
- State 1: 16999
- Max. segment length
- State 0: 661999
- State 1: 1610499
|
Intersection
|
st0 |
st1 |
total |
| Total bp |
8245638 |
10133102 |
18378740 |
| Fraction of SangerChip |
0.4846124 |
0.7890027 |
0.6155416 |
| Fraction of UcsdChip |
0.7519996 |
0.535932 |
0.6152417 |
SangerChip minus UcsdChip
|
st0 |
st1 |
total |
| Total bp |
8769274 |
2709823 |
11479097 |
| Fraction of SangerChip |
0.5153876 |
0.2109973 |
0.3844584 |
| Fraction of UcsdChip |
0.799755 |
0.1433205 |
0.3842711 |
UcsdChip minus SangerChip
|
st0 |
st1 |
both |
| Total bp |
2719312 |
8774339 |
11493651 |
| Fraction of SangerChip |
0.1598193 |
0.6832041 |
0.3849459 |
| Fraction of UcsdChip |
0.2480004 |
0.464068 |
0.3847583 |
Symmetric difference
|
st0 |
st1 |
| Total bp |
11488586 |
11484162 |
| Fraction of SangerChip |
0.6752069 |
0.8942014 |
| Fraction of UcsdChip |
1.047755 |
0.6073885 |
|