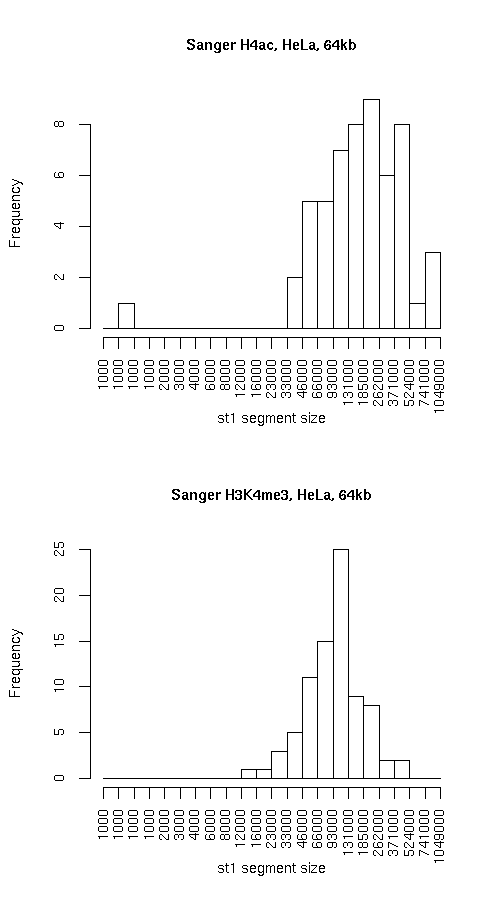
Histogram of active state (st1) segment lengths

|
Individual segmentation statistics
| Sanger H4ac, HeLa, 64kb |
Sanger H3K4me3, HeLa, 64kb |
- Number of segments
- Total size (bp)
- State 0: 16279939
- State 1: 13577945
- Avg. segment length
- State 0: 266884
- State 1: 246872
- Median segment length
- State 0: 183999
- State 1: 183999
- Min. segment length
- State 0: 22999
- State 1: 999
- Max. segment length
- State 0: 998999
- State 1: 899999
|
- Number of segments
- Total size (bp)
- State 0: 20489899
- State 1: 9367918
- Avg. segment length
- State 0: 202870
- State 1: 114243
- Median segment length
- State 0: 122999
- State 1: 99999
- Min. segment length
- State 0: 8999
- State 1: 13999
- Max. segment length
- State 0: 1038999
- State 1: 423999
|
Intersection
|
st0 |
st1 |
total |
| Total bp |
14283931 |
7371932 |
21655863 |
| Fraction of SangerChip |
0.8773946 |
0.5429343 |
0.725298 |
| Fraction of SangerChip |
0.6971206 |
0.7869339 |
0.7252996 |
SangerChip minus SangerChip
|
st0 |
st1 |
total |
| Total bp |
6205968 |
1995986 |
8201954 |
| Fraction of SangerChip |
0.3812034 |
0.1470021 |
0.2746998 |
| Fraction of SangerChip |
0.3028794 |
0.2130661 |
0.2747004 |
SangerChip minus SangerChip
|
st0 |
st1 |
both |
| Total bp |
6205968 |
1995986 |
8201954 |
| Fraction of SangerChip |
0.3812034 |
0.1470021 |
0.2746998 |
| Fraction of SangerChip |
0.3028794 |
0.2130661 |
0.2747004 |
Symmetric difference
|
st0 |
st1 |
| Total bp |
8201976 |
8201999 |
| Fraction of SangerChip |
0.5038088 |
0.6040678 |
| Fraction of SangerChip |
0.4002936 |
0.8755413 |
|


