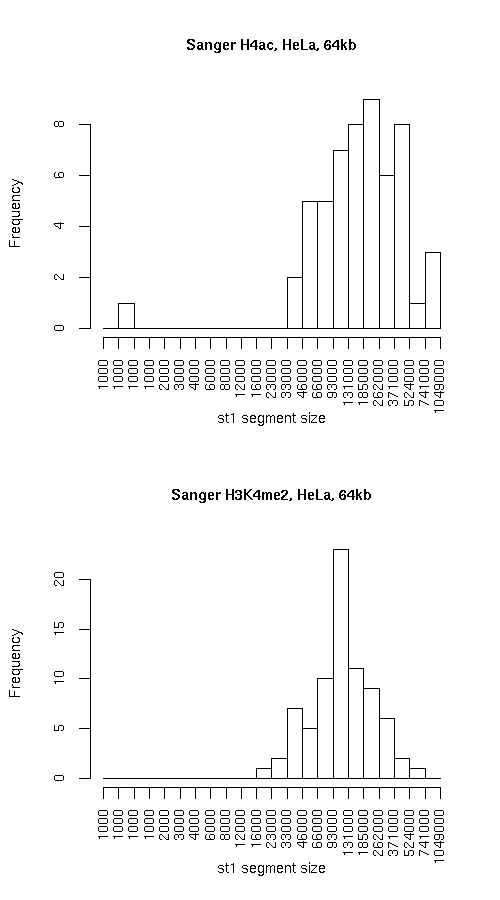
Histogram of active state (st1) segment lengths
|
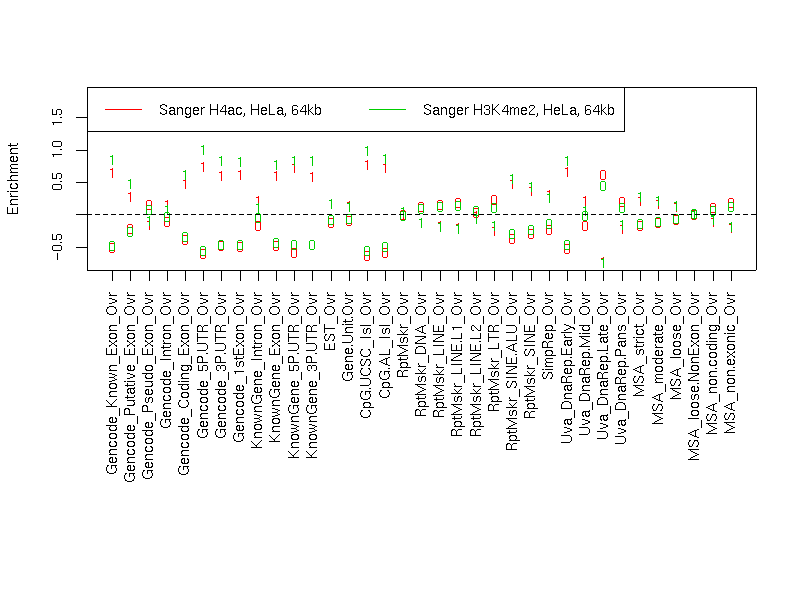
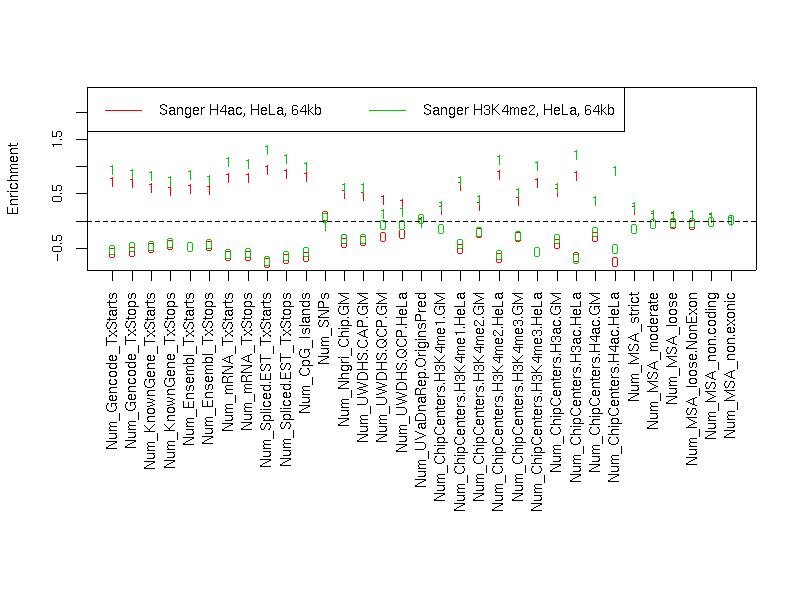
Individual segmentation statistics
| Sanger H4ac, HeLa, 64kb |
Sanger H3K4me2, HeLa, 64kb |
- Number of segments
- Total size (bp)
- State 0: 16279939
- State 1: 13577945
- Avg. segment length
- State 0: 266884
- State 1: 246872
- Median segment length
- State 0: 183999
- State 1: 183999
- Min. segment length
- State 0: 22999
- State 1: 999
- Max. segment length
- State 0: 998999
- State 1: 899999
|
- Number of segments
- Total size (bp)
- State 0: 18940905
- State 1: 10916923
- Avg. segment length
- State 0: 199378
- State 1: 141778
- Median segment length
- State 0: 110999
- State 1: 108999
- Min. segment length
- State 0: 6999
- State 1: 17999
- Max. segment length
- State 0: 1031999
- State 1: 629999
|
Intersection
|
st0 |
st1 |
total |
| Total bp |
14550934 |
9187932 |
23738866 |
| Fraction of SangerChip |
0.8937954 |
0.6766806 |
0.7950619 |
| Fraction of SangerChip |
0.768228 |
0.8416229 |
0.7950634 |
SangerChip minus SangerChip
|
st0 |
st1 |
total |
| Total bp |
4389971 |
1728991 |
6118962 |
| Fraction of SangerChip |
0.2696552 |
0.1273382 |
0.2049362 |
| Fraction of SangerChip |
0.231772 |
0.1583771 |
0.2049366 |
SangerChip minus SangerChip
|
st0 |
st1 |
both |
| Total bp |
4389971 |
1728991 |
6118962 |
| Fraction of SangerChip |
0.2696552 |
0.1273382 |
0.2049362 |
| Fraction of SangerChip |
0.231772 |
0.1583771 |
0.2049366 |
Symmetric difference
|
st0 |
st1 |
| Total bp |
6118976 |
6119004 |
| Fraction of SangerChip |
0.3758599 |
0.4506576 |
| Fraction of SangerChip |
0.3230562 |
0.5605063 |
|