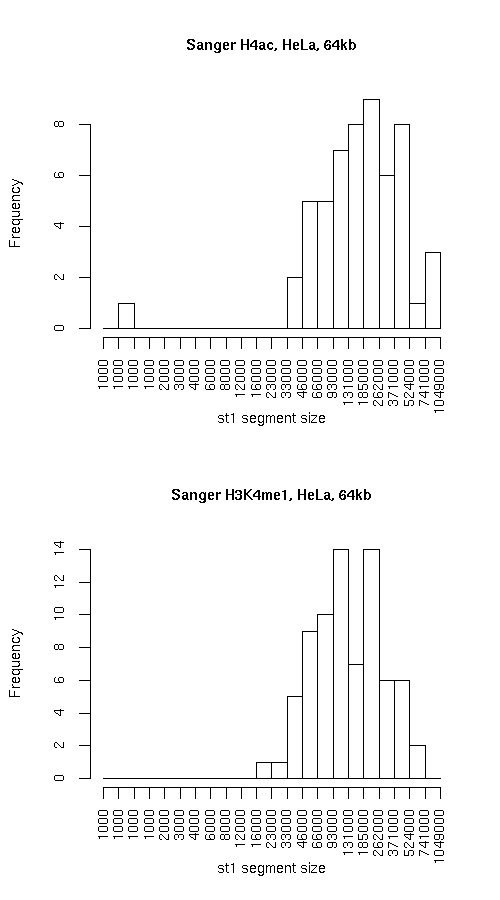
Histogram of active state (st1) segment lengths
|
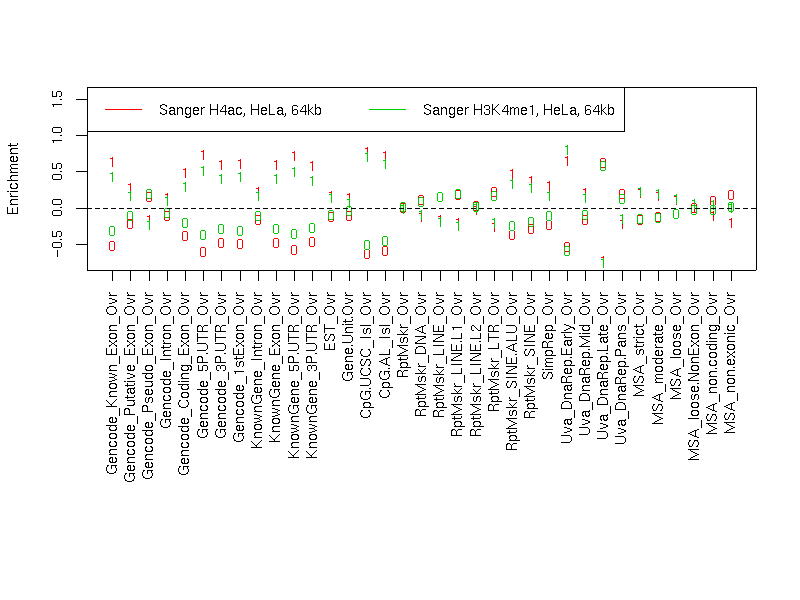
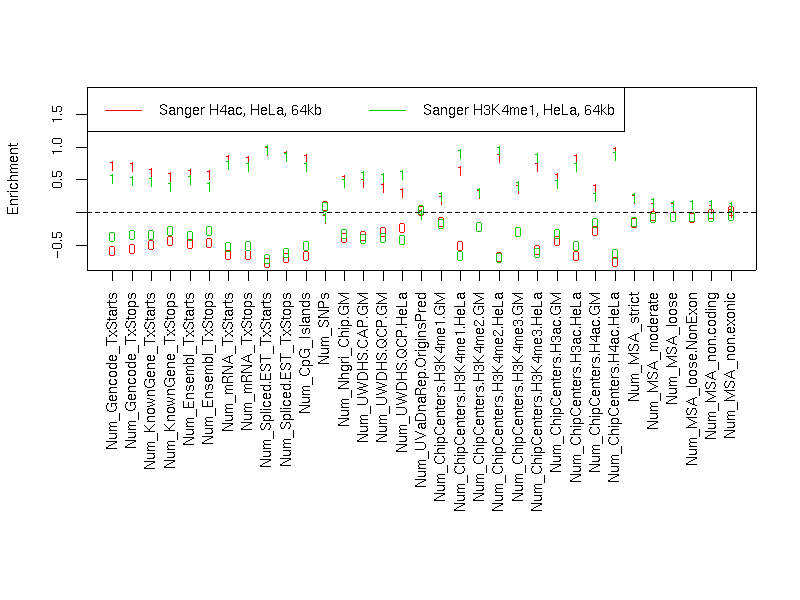
Individual segmentation statistics
| Sanger H4ac, HeLa, 64kb |
Sanger H3K4me1, HeLa, 64kb |
- Number of segments
- Total size (bp)
- State 0: 16279939
- State 1: 13577945
- Avg. segment length
- State 0: 266884
- State 1: 246872
- Median segment length
- State 0: 183999
- State 1: 183999
- Min. segment length
- State 0: 22999
- State 1: 999
- Max. segment length
- State 0: 998999
- State 1: 899999
|
- Number of segments
- Total size (bp)
- State 0: 17014912
- State 1: 12842925
- Avg. segment length
- State 0: 193351
- State 1: 171239
- Median segment length
- State 0: 118499
- State 1: 125999
- Min. segment length
- State 0: 16999
- State 1: 18999
- Max. segment length
- State 0: 998999
- State 1: 575999
|
Intersection
|
st0 |
st1 |
total |
| Total bp |
13635937 |
10198935 |
23834872 |
| Fraction of SangerChip |
0.8375914 |
0.7511398 |
0.7982773 |
| Fraction of SangerChip |
0.801411 |
0.7941287 |
0.7982786 |
SangerChip minus SangerChip
|
st0 |
st1 |
total |
| Total bp |
3378975 |
2643990 |
6022965 |
| Fraction of SangerChip |
0.2075545 |
0.1947268 |
0.2017211 |
| Fraction of SangerChip |
0.1985890 |
0.2058713 |
0.2017214 |
SangerChip minus SangerChip
|
st0 |
st1 |
both |
| Total bp |
3378975 |
2643990 |
6022965 |
| Fraction of SangerChip |
0.2075545 |
0.1947268 |
0.2017211 |
| Fraction of SangerChip |
0.1985890 |
0.2058713 |
0.2017214 |
Symmetric difference
|
st0 |
st1 |
| Total bp |
6022977 |
6023000 |
| Fraction of SangerChip |
0.3699631 |
0.443587 |
| Fraction of SangerChip |
0.3539823 |
0.4689742 |
|