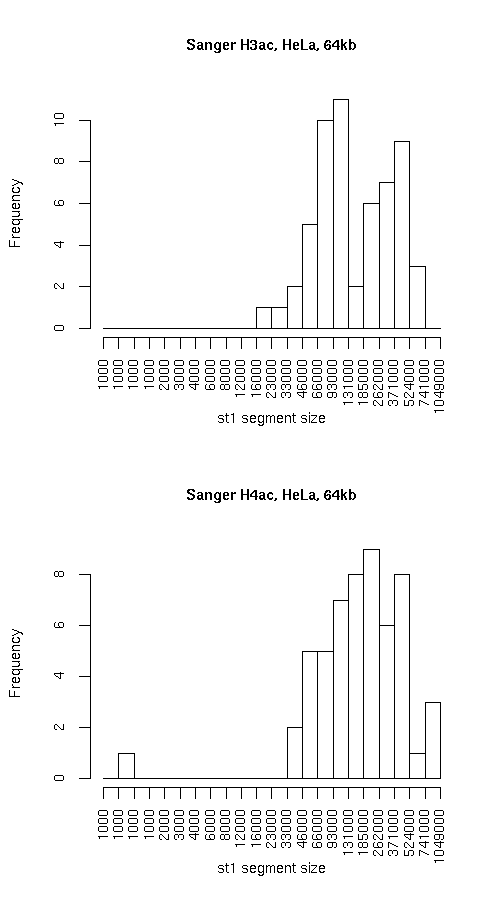
Histogram of active state (st1) segment lengths
|
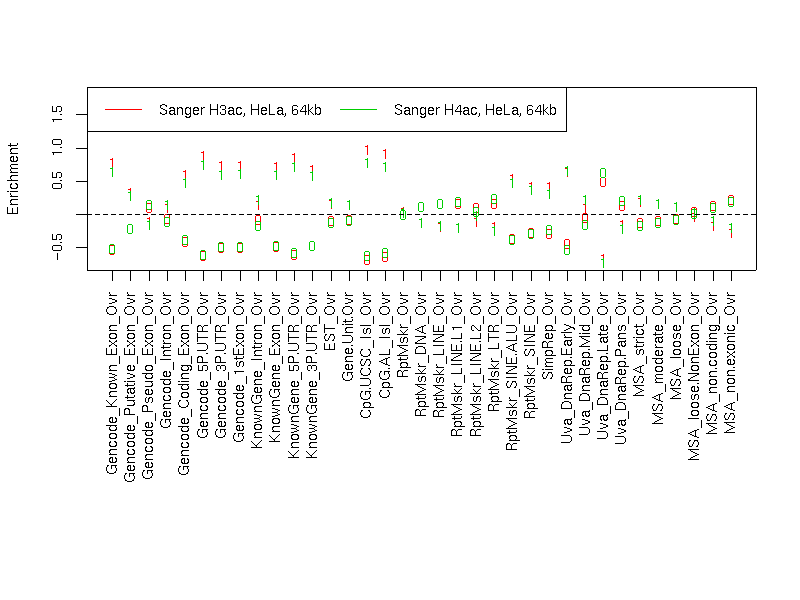
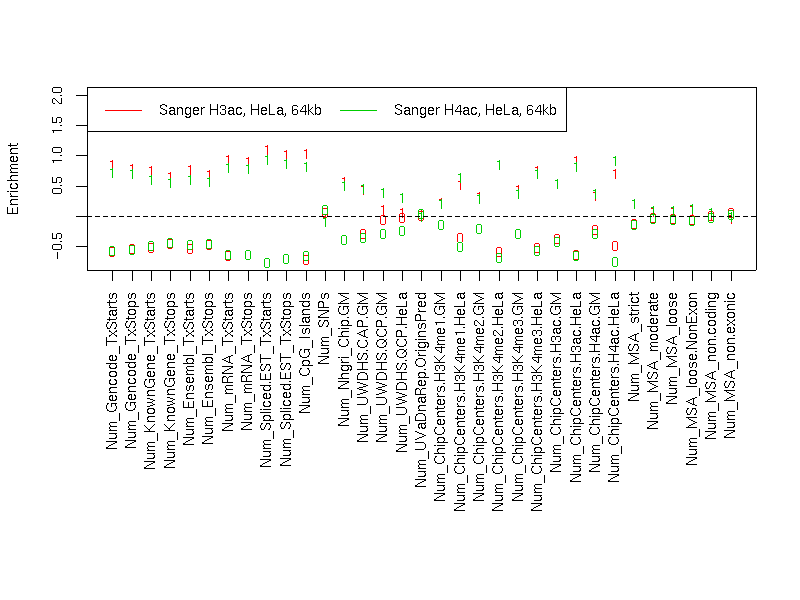
Individual segmentation statistics
| Sanger H3ac, HeLa, 64kb |
Sanger H4ac, HeLa, 64kb |
- Number of segments
- Total size (bp)
- State 0: 17347931
- State 1: 12509943
- Avg. segment length
- State 0: 251419
- State 1: 219473
- Median segment length
- State 0: 175999
- State 1: 127999
- Min. segment length
- State 0: 14999
- State 1: 20999
- Max. segment length
- State 0: 1036999
- State 1: 737999
|
- Number of segments
- Total size (bp)
- State 0: 16279939
- State 1: 13577945
- Avg. segment length
- State 0: 266884
- State 1: 246872
- Median segment length
- State 0: 183999
- State 1: 183999
- Min. segment length
- State 0: 22999
- State 1: 999
- Max. segment length
- State 0: 998999
- State 1: 899999
|
Intersection
|
st0 |
st1 |
total |
| Total bp |
14597938 |
10827947 |
25425885 |
| Fraction of SangerChip |
0.84148 |
0.8655473 |
0.8515638 |
| Fraction of SangerChip |
0.8966826 |
0.7974658 |
0.8515635 |
SangerChip minus SangerChip
|
st0 |
st1 |
total |
| Total bp |
1682001 |
2749998 |
4431999 |
| Fraction of SangerChip |
0.09695686 |
0.219825 |
0.1484365 |
| Fraction of SangerChip |
0.1033174 |
0.2025342 |
0.1484365 |
SangerChip minus SangerChip
|
st0 |
st1 |
both |
| Total bp |
1682001 |
2749998 |
4431999 |
| Fraction of SangerChip |
0.09695686 |
0.219825 |
0.1484365 |
| Fraction of SangerChip |
0.1033174 |
0.2025342 |
0.1484365 |
Symmetric difference
|
st0 |
st1 |
| Total bp |
4431994 |
4431994 |
| Fraction of SangerChip |
0.2554768 |
0.3542777 |
| Fraction of SangerChip |
0.2722365 |
0.3264113 |
|