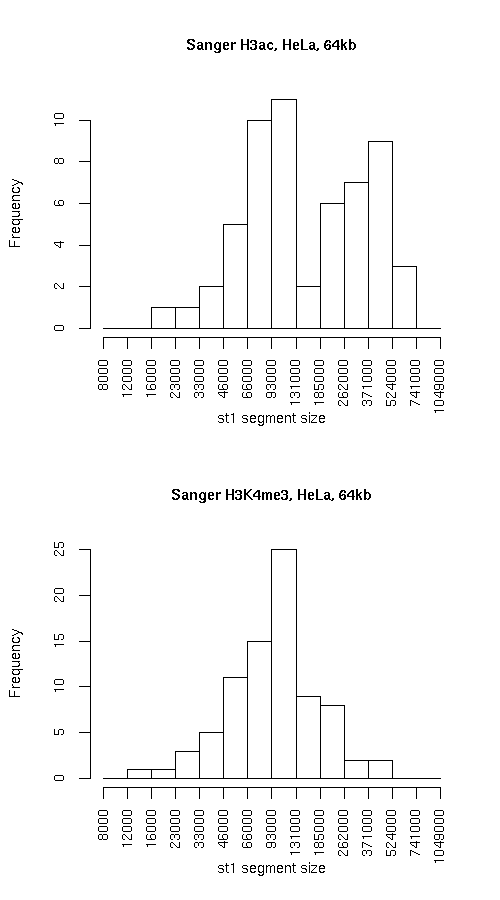
Histogram of active state (st1) segment lengths
|
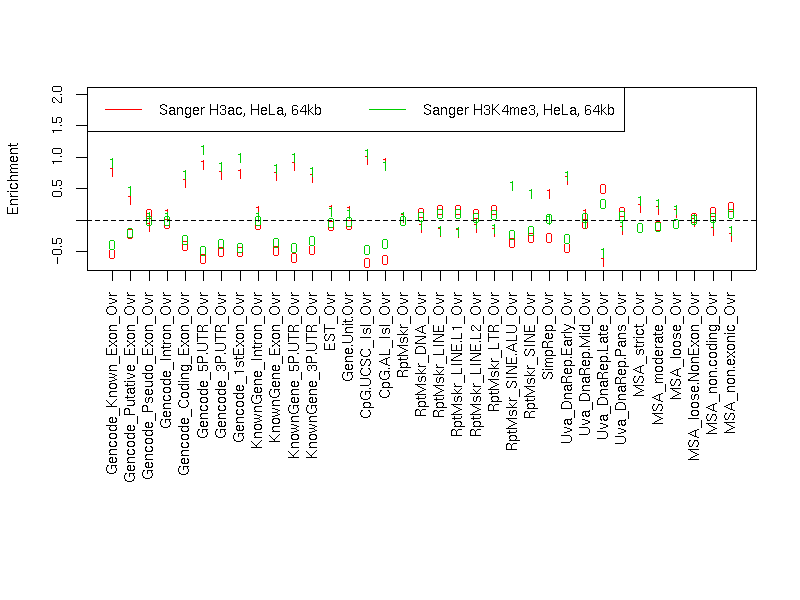
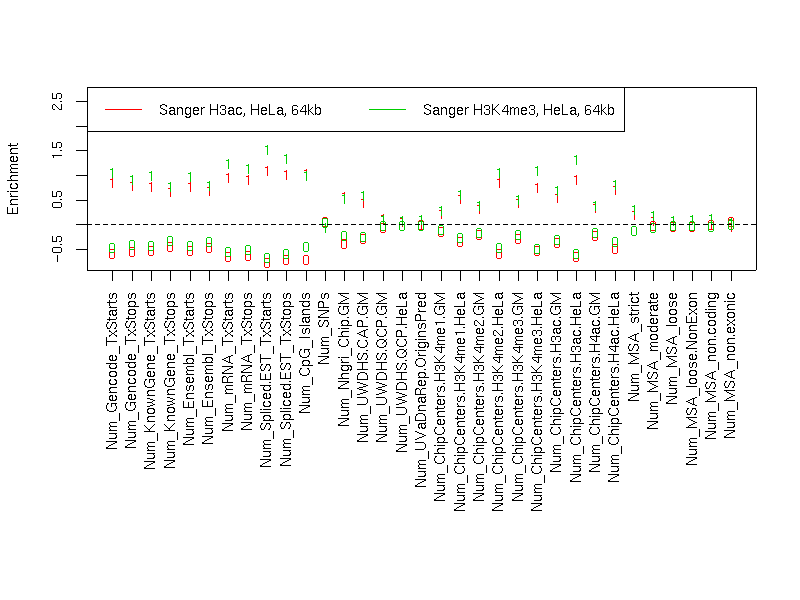
Individual segmentation statistics
| Sanger H3ac, HeLa, 64kb |
Sanger H3K4me3, HeLa, 64kb |
- Number of segments
- Total size (bp)
- State 0: 17347931
- State 1: 12509943
- Avg. segment length
- State 0: 251419
- State 1: 219473
- Median segment length
- State 0: 175999
- State 1: 127999
- Min. segment length
- State 0: 14999
- State 1: 20999
- Max. segment length
- State 0: 1036999
- State 1: 737999
|
- Number of segments
- Total size (bp)
- State 0: 20489899
- State 1: 9367918
- Avg. segment length
- State 0: 202870
- State 1: 114243
- Median segment length
- State 0: 122999
- State 1: 99999
- Min. segment length
- State 0: 8999
- State 1: 13999
- Max. segment length
- State 0: 1038999
- State 1: 423999
|
Intersection
|
st0 |
st1 |
total |
| Total bp |
15965922 |
7985932 |
23951854 |
| Fraction of SangerChip |
0.9203358 |
0.6383668 |
0.8021956 |
| Fraction of SangerChip |
0.7792094 |
0.8524767 |
0.8021971 |
SangerChip minus SangerChip
|
st0 |
st1 |
total |
| Total bp |
4523977 |
1381986 |
5905963 |
| Fraction of SangerChip |
0.2607791 |
0.110471 |
0.1978025 |
| Fraction of SangerChip |
0.2207906 |
0.1475233 |
0.1978029 |
SangerChip minus SangerChip
|
st0 |
st1 |
both |
| Total bp |
4523977 |
1381986 |
5905963 |
| Fraction of SangerChip |
0.2607791 |
0.110471 |
0.1978025 |
| Fraction of SangerChip |
0.2207906 |
0.1475233 |
0.1978029 |
Symmetric difference
|
st0 |
st1 |
| Total bp |
5905986 |
5905997 |
| Fraction of SangerChip |
0.3404432 |
0.4721042 |
| Fraction of SangerChip |
0.2882389 |
0.6304493 |
|