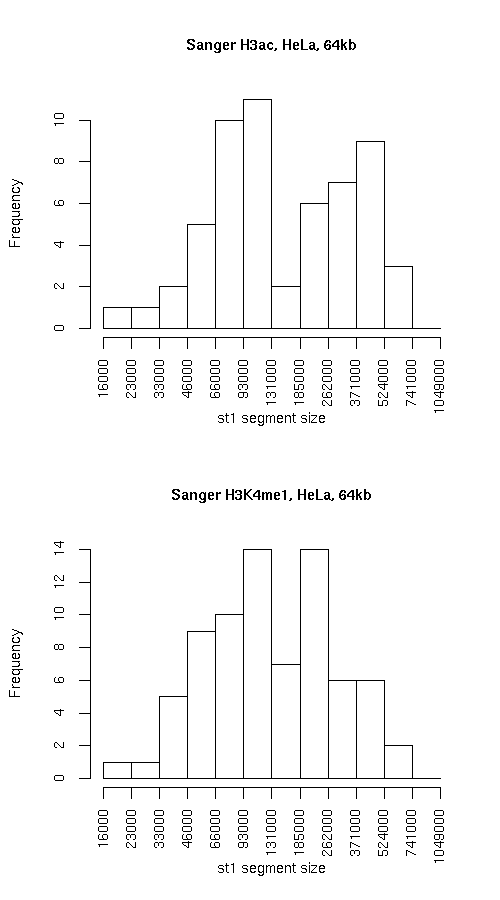
Histogram of active state (st1) segment lengths
|
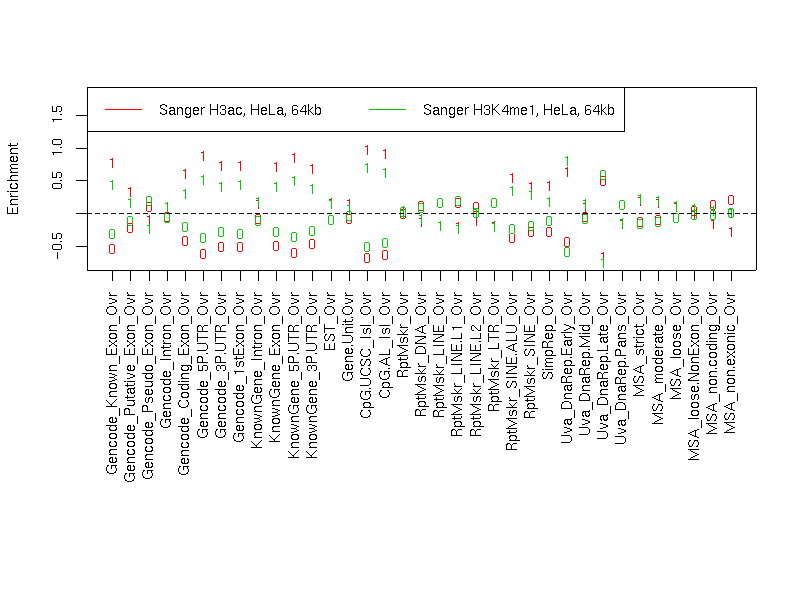
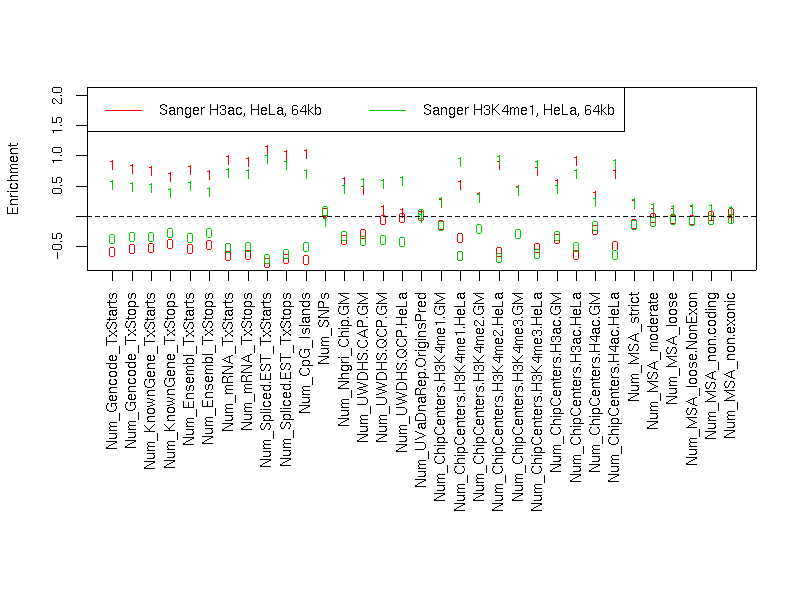
Individual segmentation statistics
| Sanger H3ac, HeLa, 64kb |
Sanger H3K4me1, HeLa, 64kb |
- Number of segments
- Total size (bp)
- State 0: 17347931
- State 1: 12509943
- Avg. segment length
- State 0: 251419
- State 1: 219473
- Median segment length
- State 0: 175999
- State 1: 127999
- Min. segment length
- State 0: 14999
- State 1: 20999
- Max. segment length
- State 0: 1036999
- State 1: 737999
|
- Number of segments
- Total size (bp)
- State 0: 17014912
- State 1: 12842925
- Avg. segment length
- State 0: 193351
- State 1: 171239
- Median segment length
- State 0: 118499
- State 1: 125999
- Min. segment length
- State 0: 16999
- State 1: 18999
- Max. segment length
- State 0: 998999
- State 1: 575999
|
Intersection
|
st0 |
st1 |
total |
| Total bp |
13122931 |
8617936 |
21740867 |
| Fraction of SangerChip |
0.7564551 |
0.6888869 |
0.7281452 |
| Fraction of SangerChip |
0.7712606 |
0.671026 |
0.7281461 |
SangerChip minus SangerChip
|
st0 |
st1 |
total |
| Total bp |
3891981 |
4224989 |
8116970 |
| Fraction of SangerChip |
0.2243484 |
0.3377305 |
0.2718536 |
| Fraction of SangerChip |
0.2287394 |
0.3289740 |
0.2718539 |
SangerChip minus SangerChip
|
st0 |
st1 |
both |
| Total bp |
3891981 |
4224989 |
8116970 |
| Fraction of SangerChip |
0.2243484 |
0.3377305 |
0.2718536 |
| Fraction of SangerChip |
0.2287394 |
0.3289740 |
0.2718539 |
Symmetric difference
|
st0 |
st1 |
| Total bp |
8116981 |
8116996 |
| Fraction of SangerChip |
0.4678933 |
0.6488436 |
| Fraction of SangerChip |
0.477051 |
0.6320208 |
|