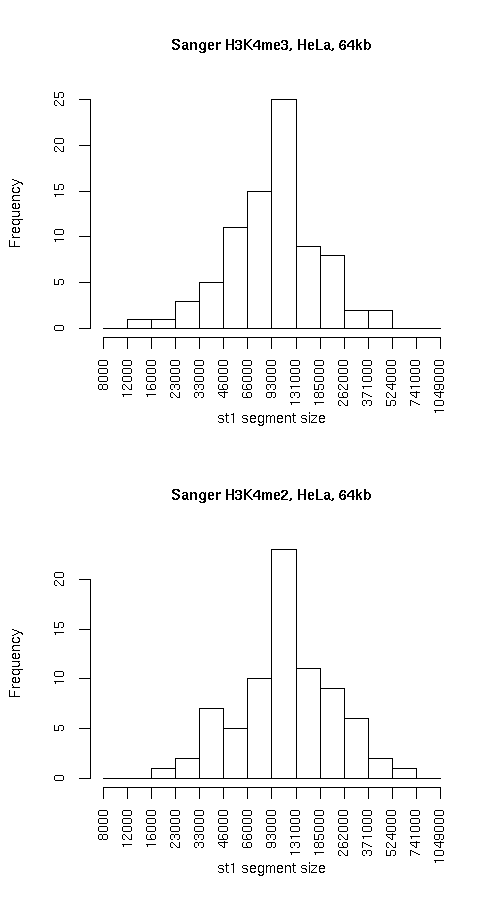
Histogram of active state (st1) segment lengths
|
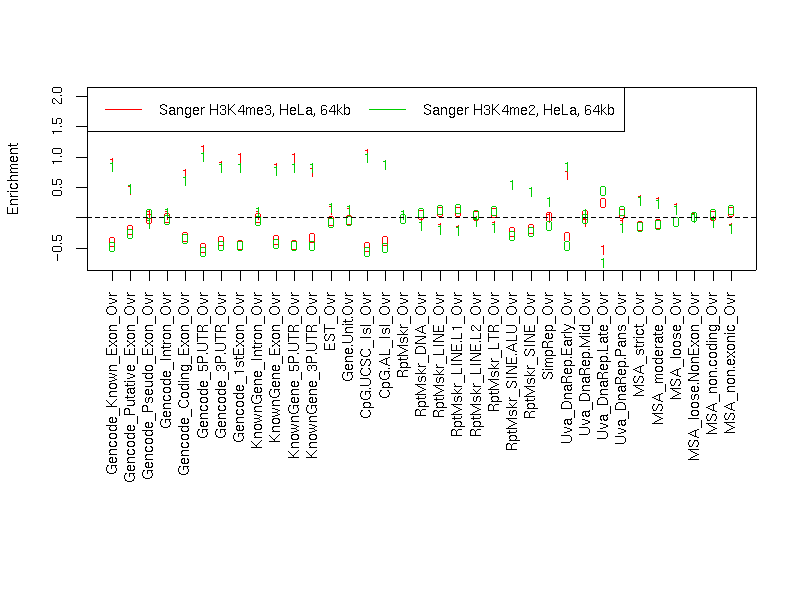
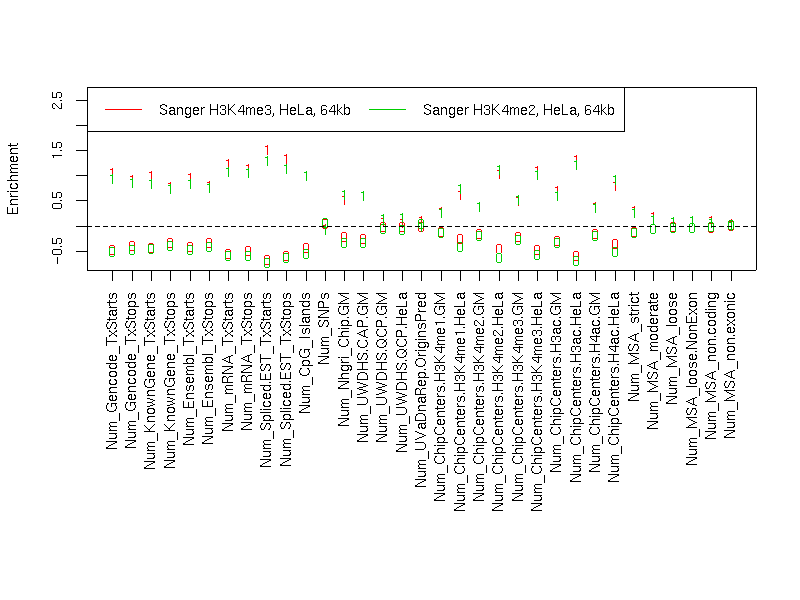
Individual segmentation statistics
| Sanger H3K4me3, HeLa, 64kb |
Sanger H3K4me2, HeLa, 64kb |
- Number of segments
- Total size (bp)
- State 0: 20489899
- State 1: 9367918
- Avg. segment length
- State 0: 202870
- State 1: 114243
- Median segment length
- State 0: 122999
- State 1: 99999
- Min. segment length
- State 0: 8999
- State 1: 13999
- Max. segment length
- State 0: 1038999
- State 1: 423999
|
- Number of segments
- Total size (bp)
- State 0: 18940905
- State 1: 10916923
- Avg. segment length
- State 0: 199378
- State 1: 141778
- Median segment length
- State 0: 110999
- State 1: 108999
- Min. segment length
- State 0: 6999
- State 1: 17999
- Max. segment length
- State 0: 1031999
- State 1: 629999
|
Intersection
|
st0 |
st1 |
total |
| Total bp |
17793899 |
8220928 |
26014827 |
| Fraction of SangerChip |
0.868423 |
0.8775619 |
0.8712903 |
| Fraction of SangerChip |
0.939443 |
0.7530444 |
0.87129 |
SangerChip minus SangerChip
|
st0 |
st1 |
total |
| Total bp |
1147006 |
2695995 |
3843001 |
| Fraction of SangerChip |
0.0559791 |
0.2877902 |
0.1287100 |
| Fraction of SangerChip |
0.06055709 |
0.2469556 |
0.12871 |
SangerChip minus SangerChip
|
st0 |
st1 |
both |
| Total bp |
1147006 |
2695995 |
3843001 |
| Fraction of SangerChip |
0.0559791 |
0.2877902 |
0.1287100 |
| Fraction of SangerChip |
0.06055709 |
0.2469556 |
0.12871 |
Symmetric difference
|
st0 |
st1 |
| Total bp |
3843006 |
3842985 |
| Fraction of SangerChip |
0.1875561 |
0.4102283 |
| Fraction of SangerChip |
0.2028945 |
0.3520209 |
|