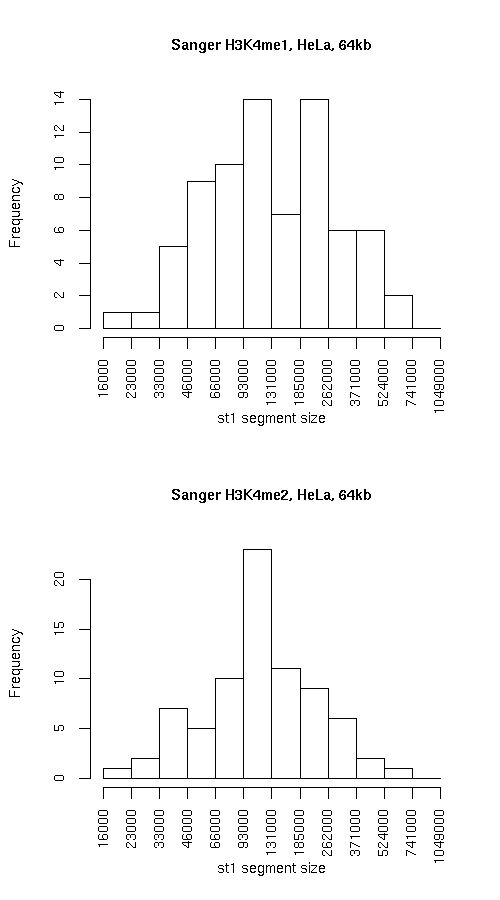
Histogram of active state (st1) segment lengths
|
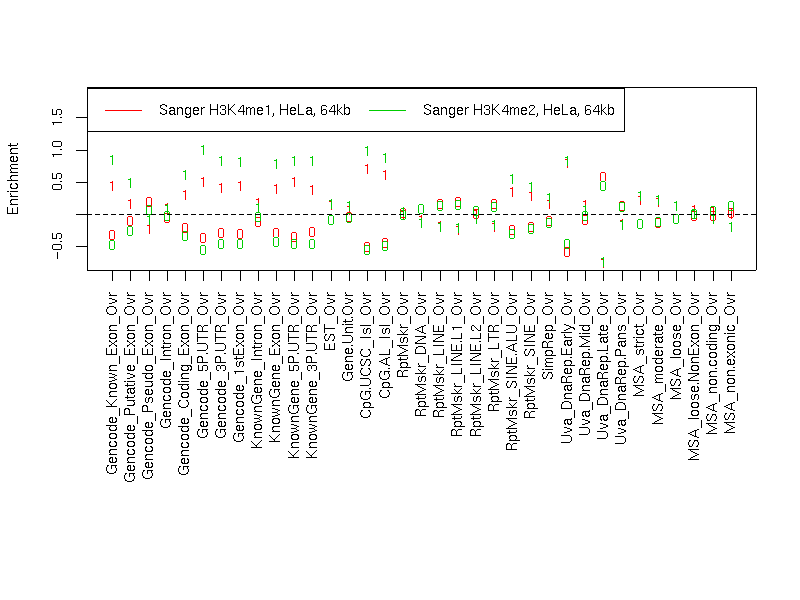
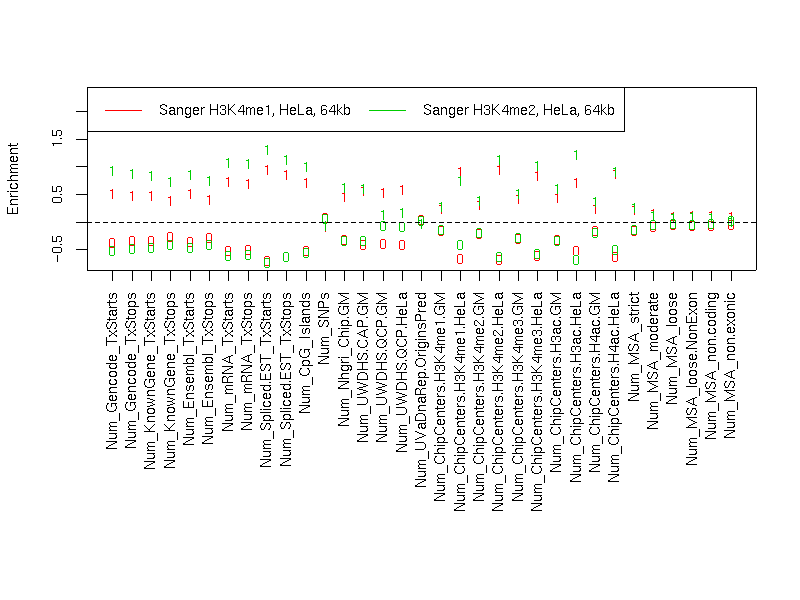
Individual segmentation statistics
| Sanger H3K4me1, HeLa, 64kb |
Sanger H3K4me2, HeLa, 64kb |
- Number of segments
- Total size (bp)
- State 0: 17014912
- State 1: 12842925
- Avg. segment length
- State 0: 193351
- State 1: 171239
- Median segment length
- State 0: 118499
- State 1: 125999
- Min. segment length
- State 0: 16999
- State 1: 18999
- Max. segment length
- State 0: 998999
- State 1: 575999
|
- Number of segments
- Total size (bp)
- State 0: 18940905
- State 1: 10916923
- Avg. segment length
- State 0: 199378
- State 1: 141778
- Median segment length
- State 0: 110999
- State 1: 108999
- Min. segment length
- State 0: 6999
- State 1: 17999
- Max. segment length
- State 0: 1031999
- State 1: 629999
|
Intersection
|
st0 |
st1 |
total |
| Total bp |
14606912 |
8508930 |
23115842 |
| Fraction of SangerChip |
0.858477 |
0.6625383 |
0.7741968 |
| Fraction of SangerChip |
0.7711834 |
0.7794257 |
0.774197 |
SangerChip minus SangerChip
|
st0 |
st1 |
total |
| Total bp |
4333993 |
2407993 |
6741986 |
| Fraction of SangerChip |
0.2547173 |
0.1874957 |
0.2258029 |
| Fraction of SangerChip |
0.2288166 |
0.2205743 |
0.2258030 |
SangerChip minus SangerChip
|
st0 |
st1 |
both |
| Total bp |
4333993 |
2407993 |
6741986 |
| Fraction of SangerChip |
0.2547173 |
0.1874957 |
0.2258029 |
| Fraction of SangerChip |
0.2288166 |
0.2205743 |
0.2258030 |
Symmetric difference
|
st0 |
st1 |
| Total bp |
6741993 |
6741988 |
| Fraction of SangerChip |
0.3962403 |
0.5249574 |
| Fraction of SangerChip |
0.3559488 |
0.6175722 |
|