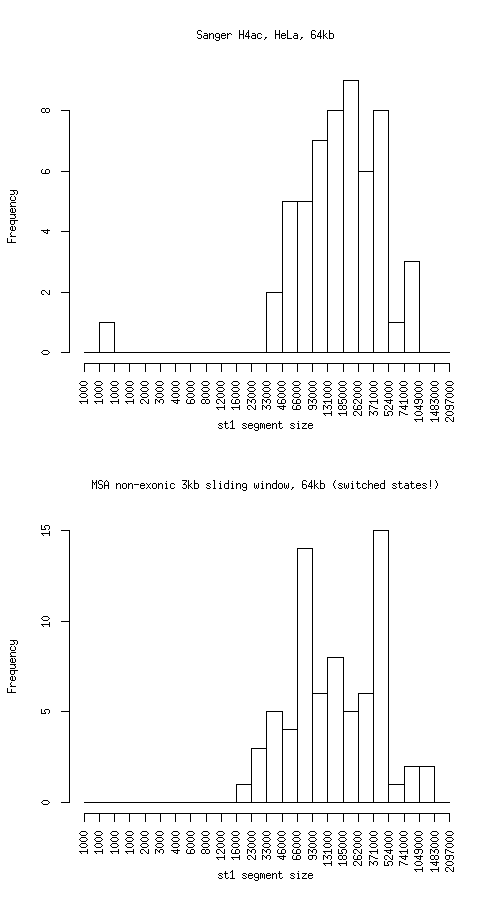
Histogram of active state (st1) segment lengths
|
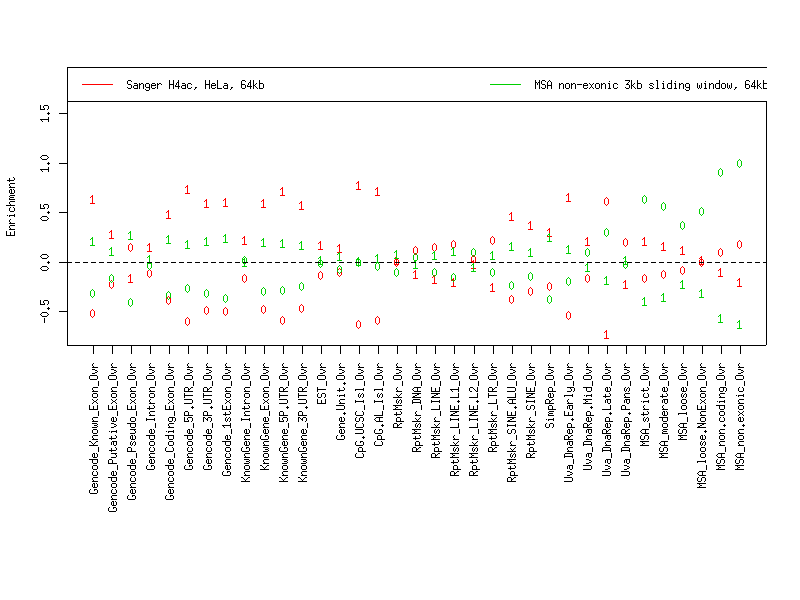
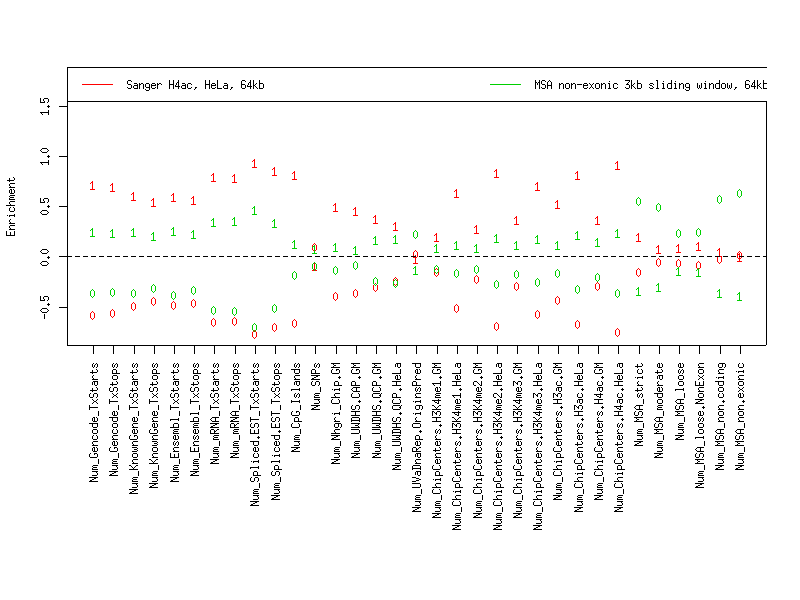
Individual segmentation statistics
| Sanger H4ac, HeLa, 64kb |
MSA non-exonic 3kb sliding window, 64kb (switched states!) |
- Number of segments
- Total size (bp)
- State 0: 16279939
- State 1: 13577945
- Avg. segment length
- State 0: 266884
- State 1: 246872
- Median segment length
- State 0: 183999
- State 1: 183999
- Min. segment length
- State 0: 22999
- State 1: 999
- Max. segment length
- State 0: 998999
- State 1: 899999
|
- Number of segments
- Total size (bp)
- State 0: 11680425
- State 1: 18317635
- Avg. segment length
- State 0: 204920
- State 1: 254412
- Median segment length
- State 0: 146000
- State 1: 149000
- Min. segment length
- State 0: 14000
- State 1: 22000
- Max. segment length
- State 0: 1000000
- State 1: 1353000
|
Intersection
|
st0 |
st1 |
total |
| Total bp |
8192931 |
10121216 |
18314147 |
| Fraction of SangerChip |
0.5032532 |
0.7454159 |
0.6133773 |
| Fraction of MSA |
0.701424 |
0.5525395 |
0.610511 |
SangerChip minus MSA
|
st0 |
st1 |
total |
| Total bp |
8087008 |
3456729 |
11543737 |
| Fraction of SangerChip |
0.4967468 |
0.2545841 |
0.3866227 |
| Fraction of MSA |
0.6923556 |
0.1887104 |
0.3848161 |
MSA minus SangerChip
|
st0 |
st1 |
both |
| Total bp |
3487494 |
8196419 |
11683913 |
| Fraction of SangerChip |
0.2142203 |
0.6036568 |
0.3913175 |
| Fraction of MSA |
0.2985760 |
0.4474605 |
0.3894890 |
Symmetric difference
|
st0 |
st1 |
| Total bp |
11574502 |
11653148 |
| Fraction of SangerChip |
0.7109672 |
0.858241 |
| Fraction of MSA |
0.9909316 |
0.636171 |
|