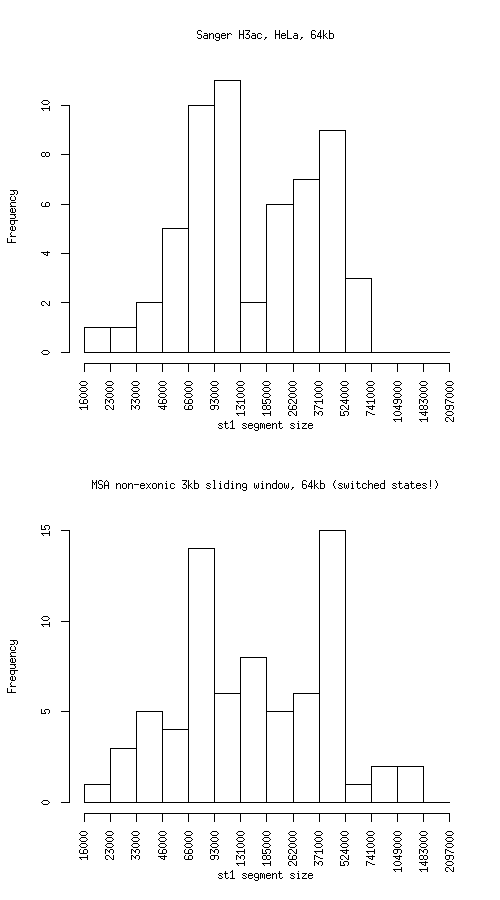
Histogram of active state (st1) segment lengths
|
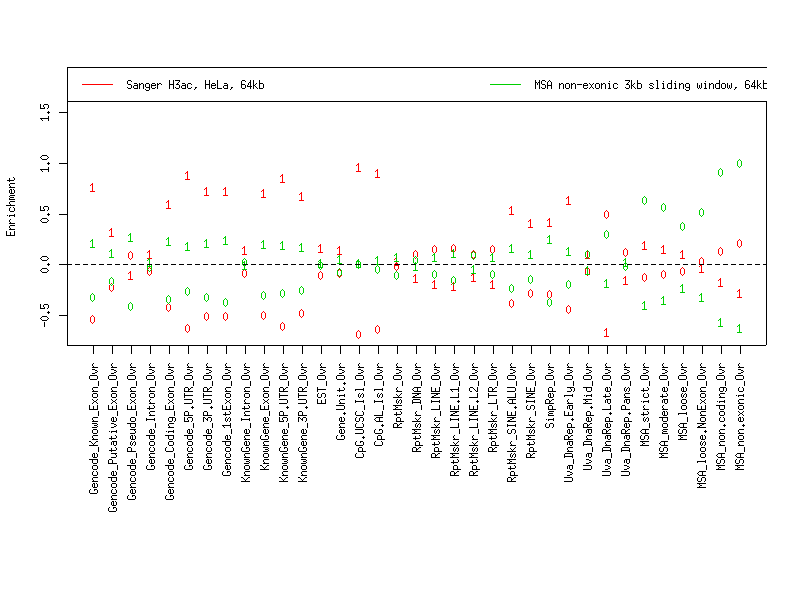
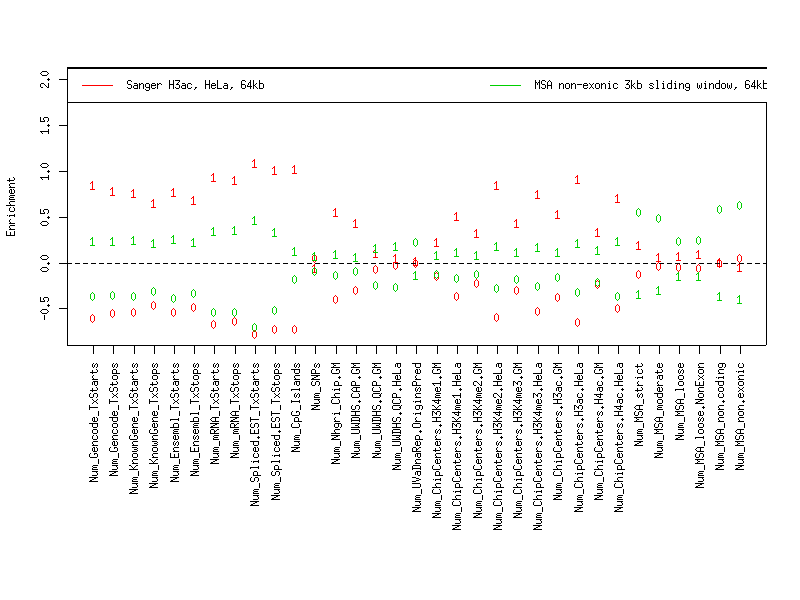
Individual segmentation statistics
| Sanger H3ac, HeLa, 64kb |
MSA non-exonic 3kb sliding window, 64kb (switched states!) |
- Number of segments
- Total size (bp)
- State 0: 17347931
- State 1: 12509943
- Avg. segment length
- State 0: 251419
- State 1: 219473
- Median segment length
- State 0: 175999
- State 1: 127999
- Min. segment length
- State 0: 14999
- State 1: 20999
- Max. segment length
- State 0: 1036999
- State 1: 737999
|
- Number of segments
- Total size (bp)
- State 0: 11680425
- State 1: 18317635
- Avg. segment length
- State 0: 204920
- State 1: 254412
- Median segment length
- State 0: 146000
- State 1: 149000
- Min. segment length
- State 0: 14000
- State 1: 22000
- Max. segment length
- State 0: 1000000
- State 1: 1353000
|
Intersection
|
st0 |
st1 |
total |
| Total bp |
8971009 |
9831289 |
18802298 |
| Fraction of SangerChip |
0.5171227 |
0.785878 |
0.6297266 |
| Fraction of MSA |
0.7680379 |
0.5367117 |
0.6267838 |
SangerChip minus MSA
|
st0 |
st1 |
total |
| Total bp |
8376922 |
2678654 |
11055576 |
| Fraction of SangerChip |
0.4828773 |
0.214122 |
0.3702734 |
| Fraction of MSA |
0.7171761 |
0.1462336 |
0.368543 |
MSA minus SangerChip
|
st0 |
st1 |
both |
| Total bp |
2709416 |
8486346 |
11195762 |
| Fraction of SangerChip |
0.1561809 |
0.6783681 |
0.3749685 |
| Fraction of MSA |
0.2319621 |
0.4632883 |
0.3732162 |
Symmetric difference
|
st0 |
st1 |
| Total bp |
11086338 |
11165000 |
| Fraction of SangerChip |
0.6390582 |
0.89249 |
| Fraction of MSA |
0.9491382 |
0.6095219 |
|