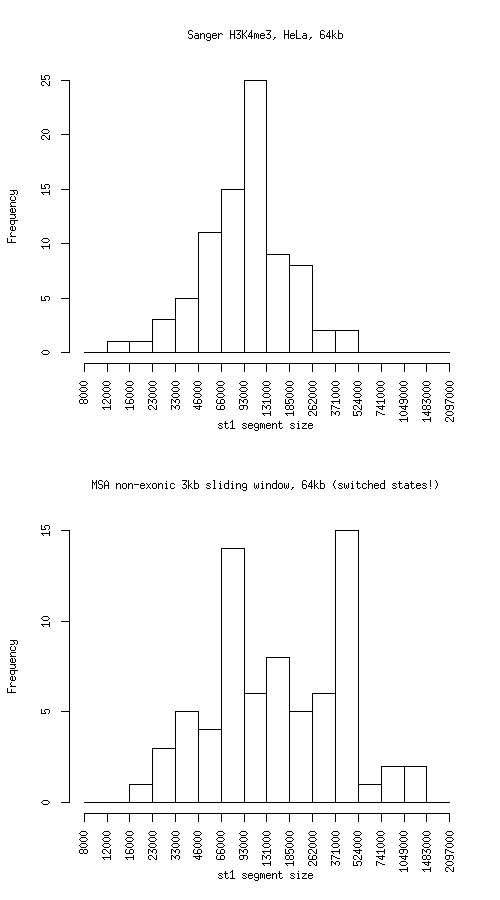
Histogram of active state (st1) segment lengths
|
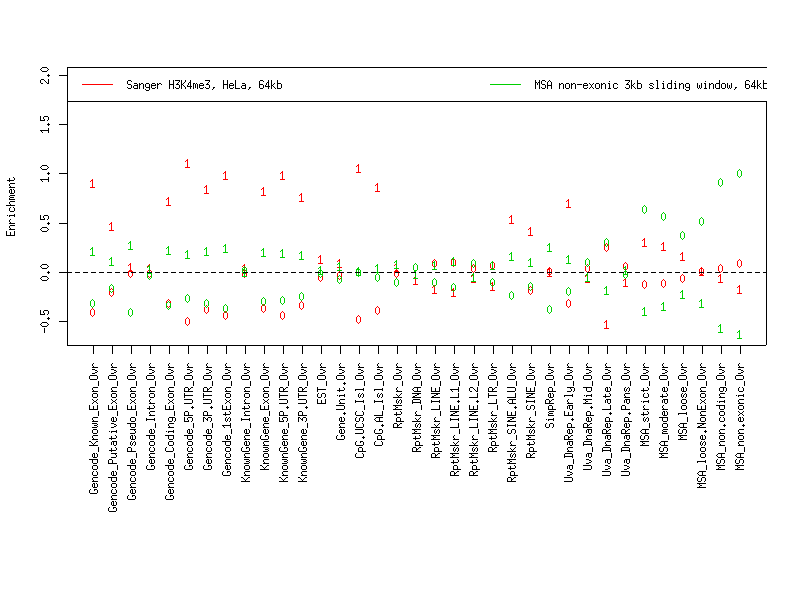
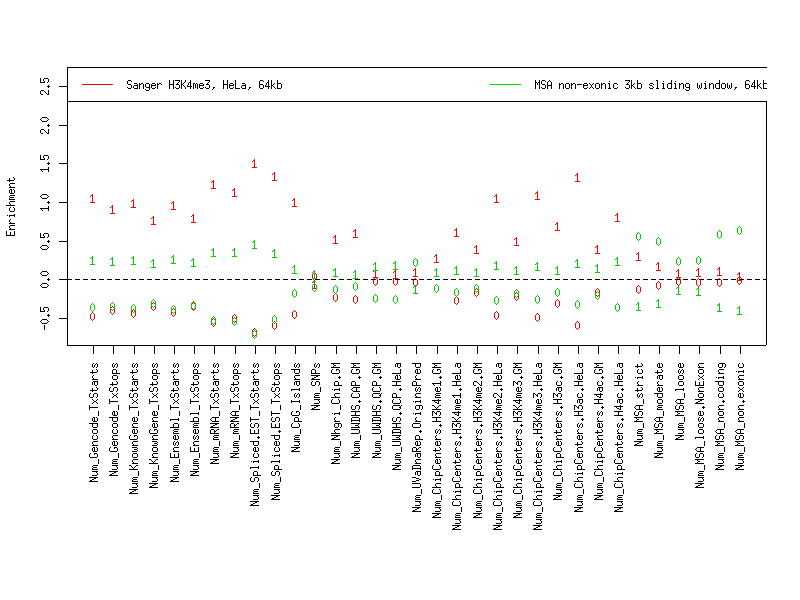
Individual segmentation statistics
| Sanger H3K4me3, HeLa, 64kb |
MSA non-exonic 3kb sliding window, 64kb (switched states!) |
- Number of segments
- Total size (bp)
- State 0: 20489899
- State 1: 9367918
- Avg. segment length
- State 0: 202870
- State 1: 114243
- Median segment length
- State 0: 122999
- State 1: 99999
- Min. segment length
- State 0: 8999
- State 1: 13999
- Max. segment length
- State 0: 1038999
- State 1: 423999
|
- Number of segments
- Total size (bp)
- State 0: 11680425
- State 1: 18317635
- Avg. segment length
- State 0: 204920
- State 1: 254412
- Median segment length
- State 0: 146000
- State 1: 149000
- Min. segment length
- State 0: 14000
- State 1: 22000
- Max. segment length
- State 0: 1000000
- State 1: 1353000
|
Intersection
|
st0 |
st1 |
total |
| Total bp |
9048736 |
6767146 |
15815882 |
| Fraction of SangerChip |
0.4416194 |
0.7223746 |
0.5297066 |
| Fraction of MSA |
0.7746924 |
0.3694334 |
0.5272302 |
SangerChip minus MSA
|
st0 |
st1 |
total |
| Total bp |
11441163 |
2600772 |
14041935 |
| Fraction of SangerChip |
0.5583806 |
0.2776254 |
0.4702934 |
| Fraction of MSA |
0.979516 |
0.1419819 |
0.4680948 |
MSA minus SangerChip
|
st0 |
st1 |
both |
| Total bp |
2631689 |
11550489 |
14182178 |
| Fraction of SangerChip |
0.1284384 |
1.232984 |
0.4749905 |
| Fraction of MSA |
0.2253076 |
0.6305666 |
0.4727698 |
Symmetric difference
|
st0 |
st1 |
| Total bp |
14072852 |
14151261 |
| Fraction of SangerChip |
0.686819 |
1.510609 |
| Fraction of MSA |
1.204824 |
0.7725485 |
|