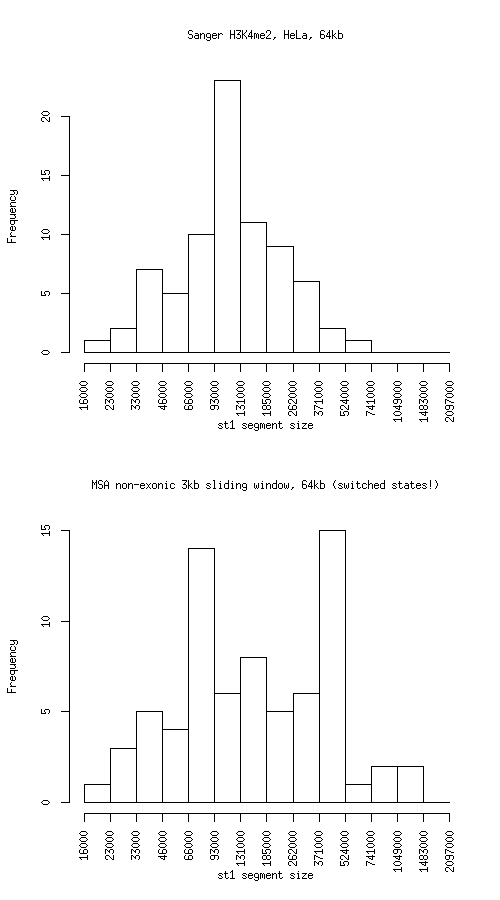
Histogram of active state (st1) segment lengths
|
Individual segmentation statistics
| Sanger H3K4me2, HeLa, 64kb |
MSA non-exonic 3kb sliding window, 64kb (switched states!) |
- Number of segments
- Total size (bp)
- State 0: 18940905
- State 1: 10916923
- Avg. segment length
- State 0: 199378
- State 1: 141778
- Median segment length
- State 0: 110999
- State 1: 108999
- Min. segment length
- State 0: 6999
- State 1: 17999
- Max. segment length
- State 0: 1031999
- State 1: 629999
|
- Number of segments
- Total size (bp)
- State 0: 11680425
- State 1: 18317635
- Avg. segment length
- State 0: 204920
- State 1: 254412
- Median segment length
- State 0: 146000
- State 1: 149000
- Min. segment length
- State 0: 14000
- State 1: 22000
- Max. segment length
- State 0: 1000000
- State 1: 1353000
|
Intersection
|
st0 |
st1 |
total |
| Total bp |
9022378 |
8289646 |
17312024 |
| Fraction of SangerChip |
0.4763436 |
0.759339 |
0.5798152 |
| Fraction of MSA |
0.7724358 |
0.45255 |
0.5771048 |
SangerChip minus MSA
|
st0 |
st1 |
total |
| Total bp |
9918527 |
2627277 |
12545804 |
| Fraction of SangerChip |
0.5236564 |
0.2406609 |
0.4201848 |
| Fraction of MSA |
0.849158 |
0.1434288 |
0.4182205 |
MSA minus SangerChip
|
st0 |
st1 |
both |
| Total bp |
2658047 |
10027989 |
12686036 |
| Fraction of SangerChip |
0.1403337 |
0.9185728 |
0.4248814 |
| Fraction of MSA |
0.2275642 |
0.54745 |
0.4228952 |
Symmetric difference
|
st0 |
st1 |
| Total bp |
12576574 |
12655266 |
| Fraction of SangerChip |
0.6639901 |
1.159234 |
| Fraction of MSA |
1.076722 |
0.6908788 |
|