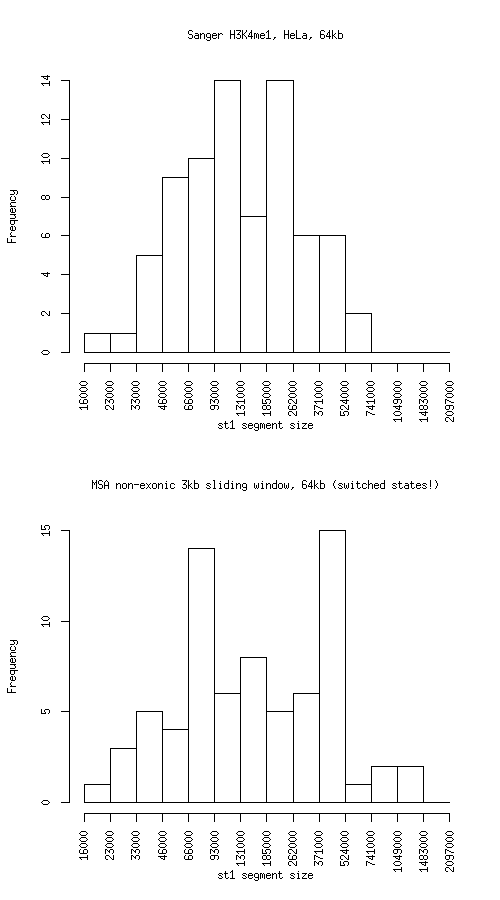
Histogram of active state (st1) segment lengths
|
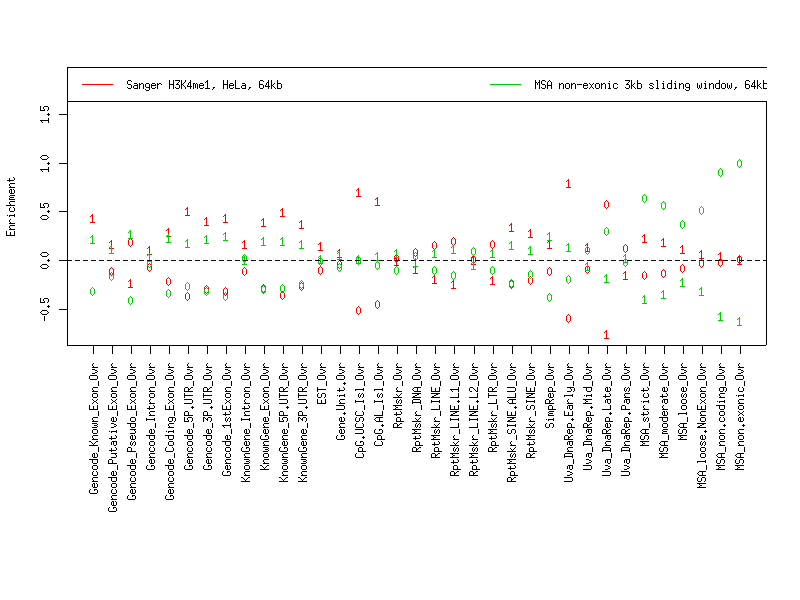
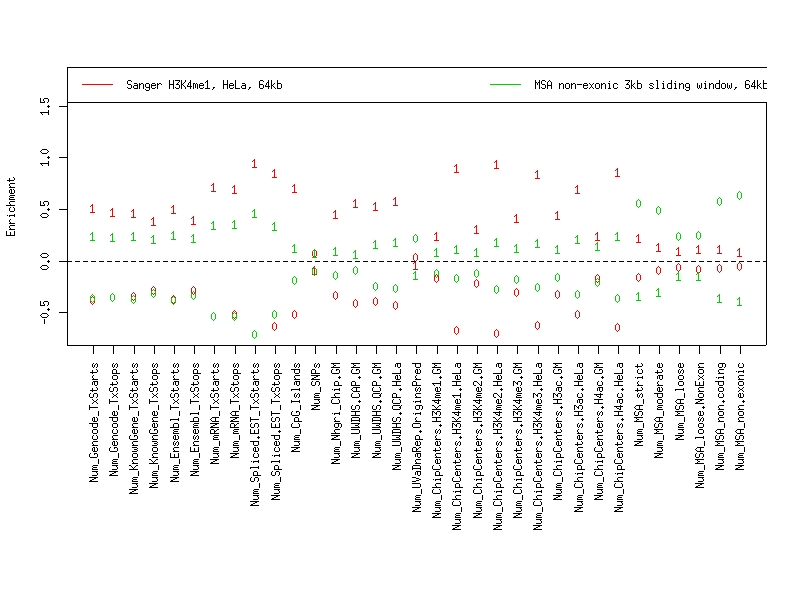
Individual segmentation statistics
| Sanger H3K4me1, HeLa, 64kb |
MSA non-exonic 3kb sliding window, 64kb (switched states!) |
- Number of segments
- Total size (bp)
- State 0: 17014912
- State 1: 12842925
- Avg. segment length
- State 0: 193351
- State 1: 171239
- Median segment length
- State 0: 118499
- State 1: 125999
- Min. segment length
- State 0: 16999
- State 1: 18999
- Max. segment length
- State 0: 998999
- State 1: 575999
|
- Number of segments
- Total size (bp)
- State 0: 11680425
- State 1: 18317635
- Avg. segment length
- State 0: 204920
- State 1: 254412
- Median segment length
- State 0: 146000
- State 1: 149000
- Min. segment length
- State 0: 14000
- State 1: 22000
- Max. segment length
- State 0: 1000000
- State 1: 1353000
|
Intersection
|
st0 |
st1 |
total |
| Total bp |
7706515 |
8899934 |
16606449 |
| Fraction of SangerChip |
0.4529271 |
0.6929834 |
0.5561839 |
| Fraction of MSA |
0.6597804 |
0.485867 |
0.5535841 |
SangerChip minus MSA
|
st0 |
st1 |
total |
| Total bp |
9308397 |
3942991 |
13251388 |
| Fraction of SangerChip |
0.5470729 |
0.3070166 |
0.4438161 |
| Fraction of MSA |
0.7969228 |
0.2152566 |
0.4417415 |
MSA minus SangerChip
|
st0 |
st1 |
both |
| Total bp |
3973910 |
9417701 |
13391611 |
| Fraction of SangerChip |
0.2335545 |
0.7332988 |
0.4485124 |
| Fraction of MSA |
0.3402196 |
0.514133 |
0.4464159 |
Symmetric difference
|
st0 |
st1 |
| Total bp |
13282307 |
13360692 |
| Fraction of SangerChip |
0.7806274 |
1.040315 |
| Fraction of MSA |
1.137142 |
0.7293896 |
|