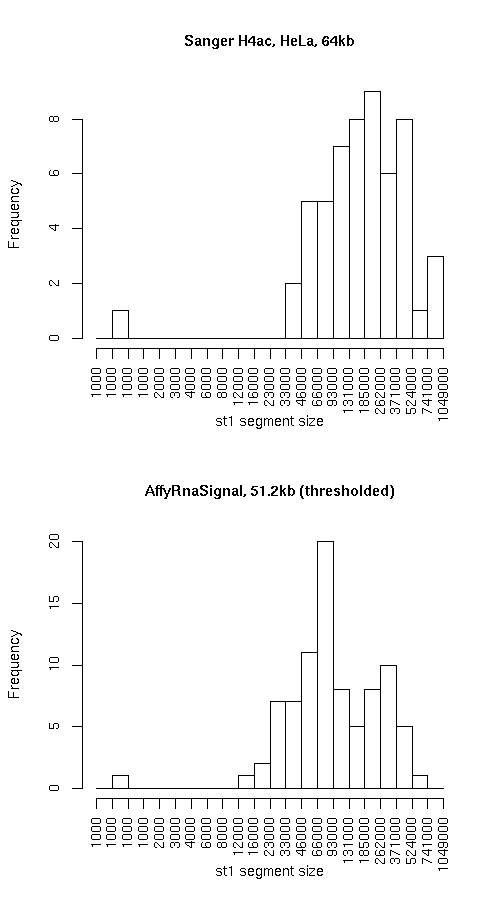
Histogram of active state (st1) segment lengths
|
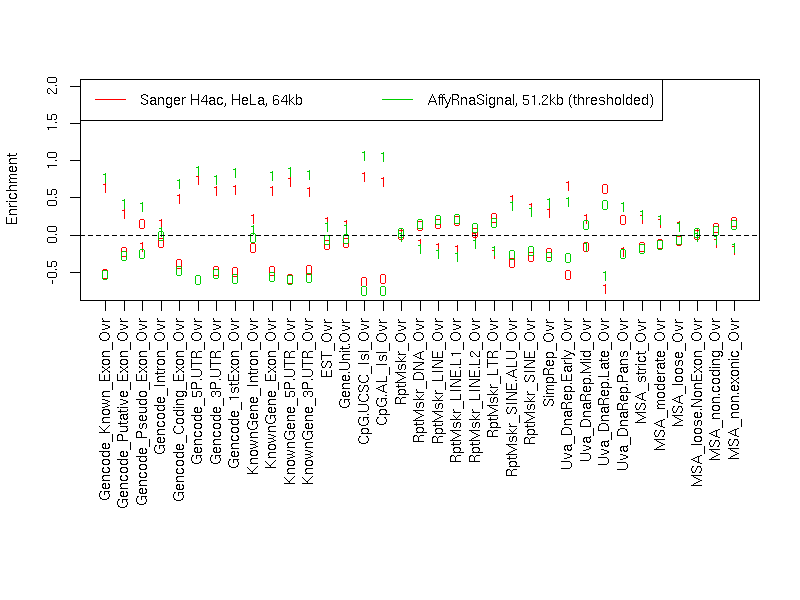
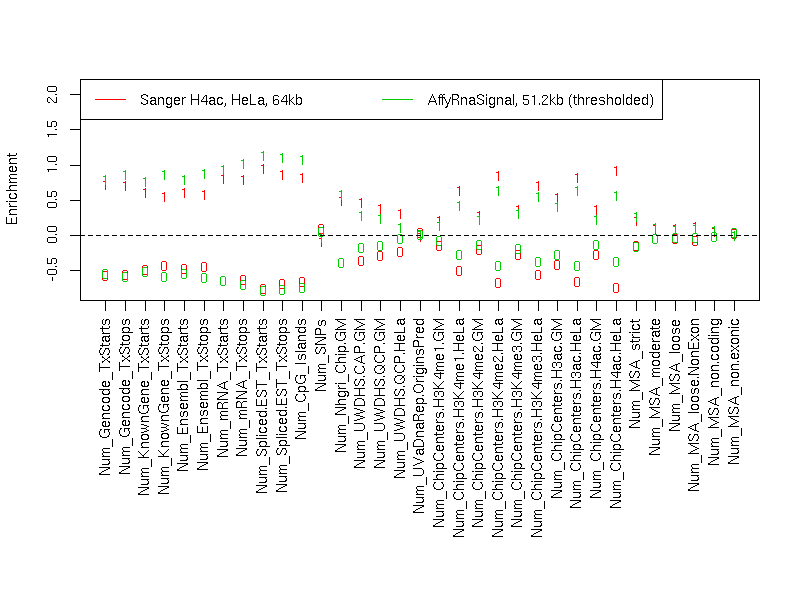
Individual segmentation statistics
| Sanger H4ac, HeLa, 64kb |
AffyRnaSignal, 51.2kb (thresholded) |
- Number of segments
- Total size (bp)
- State 0: 16279939
- State 1: 13577945
- Avg. segment length
- State 0: 266884
- State 1: 246872
- Median segment length
- State 0: 183999
- State 1: 183999
- Min. segment length
- State 0: 22999
- State 1: 999
- Max. segment length
- State 0: 998999
- State 1: 899999
|
- Number of segments
- Total size (bp)
- State 0: 17082205
- State 1: 12275464
- Avg. segment length
- State 0: 179813
- State 1: 142738
- Median segment length
- State 0: 111399
- State 1: 84099
- Min. segment length
- State 0: 10799
- State 1: 749
- Max. segment length
- State 0: 1124499
- State 1: 680149
|
Intersection
|
st0 |
st1 |
total |
| Total bp |
12732399 |
8924130 |
21656529 |
| Fraction of SangerChip |
0.7820913 |
0.6572519 |
0.7253203 |
| Fraction of AffyRnaSignal |
0.7453604 |
0.7269892 |
0.7376788 |
SangerChip minus AffyRnaSignal
|
st0 |
st1 |
total |
| Total bp |
3547540 |
4653815 |
8201355 |
| Fraction of SangerChip |
0.2179087 |
0.3427481 |
0.2746797 |
| Fraction of AffyRnaSignal |
0.2076746 |
0.3791152 |
0.2793599 |
AffyRnaSignal minus SangerChip
|
st0 |
st1 |
both |
| Total bp |
4349806 |
3351334 |
7701140 |
| Fraction of SangerChip |
0.2671881 |
0.2468219 |
0.2579265 |
| Fraction of AffyRnaSignal |
0.2546396 |
0.2730108 |
0.2623212 |
Symmetric difference
|
st0 |
st1 |
| Total bp |
7897346 |
8005149 |
| Fraction of SangerChip |
0.4850968 |
0.58957 |
| Fraction of AffyRnaSignal |
0.4623142 |
0.652126 |
|