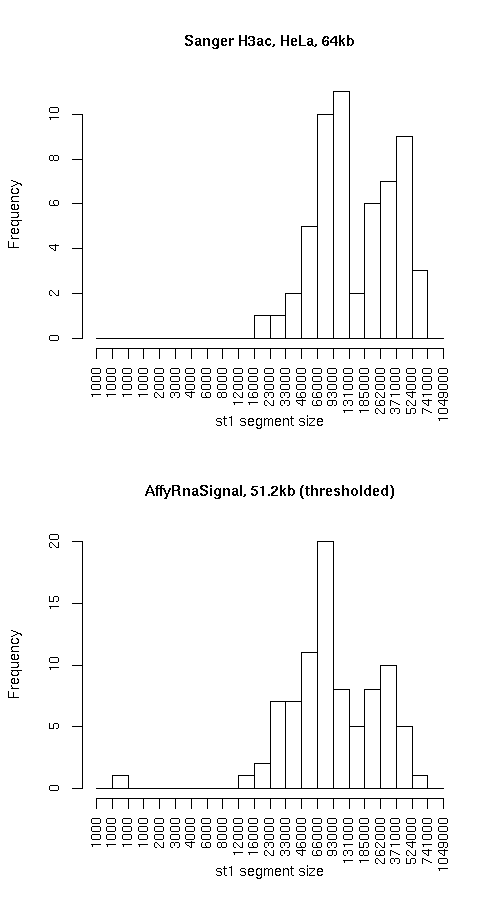
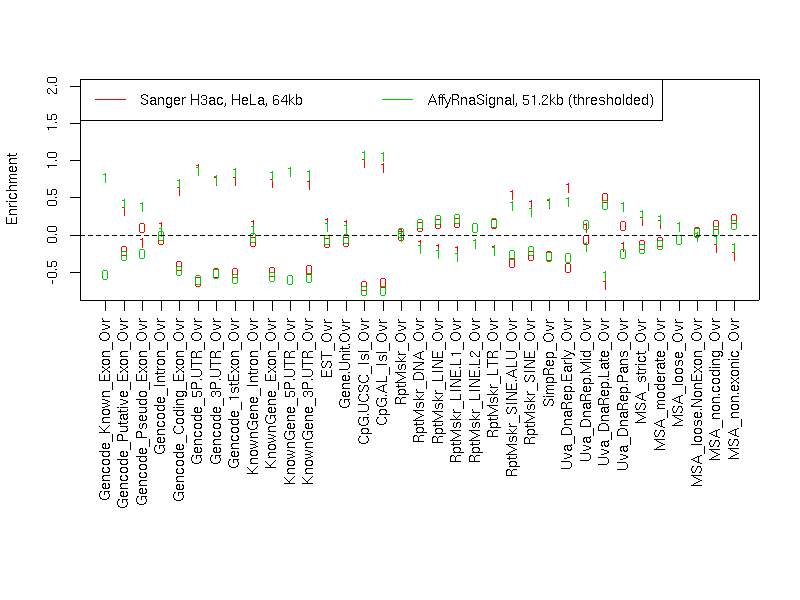
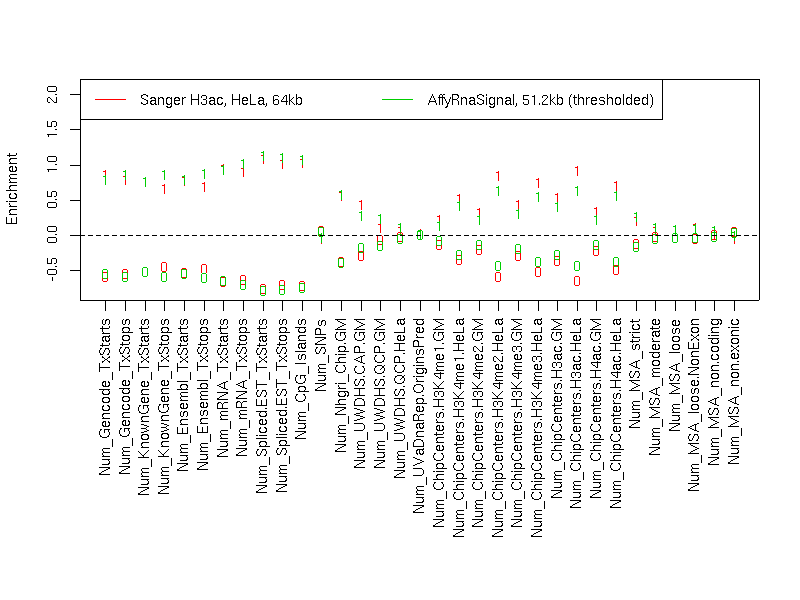
Histogram of active state (st1) segment lengths

|
Individual segmentation statistics
| Sanger H3ac, HeLa, 64kb |
AffyRnaSignal, 51.2kb (thresholded) |
- Number of segments
- Total size (bp)
- State 0: 17347931
- State 1: 12509943
- Avg. segment length
- State 0: 251419
- State 1: 219473
- Median segment length
- State 0: 175999
- State 1: 127999
- Min. segment length
- State 0: 14999
- State 1: 20999
- Max. segment length
- State 0: 1036999
- State 1: 737999
|
- Number of segments
- Total size (bp)
- State 0: 17082205
- State 1: 12275464
- Avg. segment length
- State 0: 179813
- State 1: 142738
- Median segment length
- State 0: 111399
- State 1: 84099
- Min. segment length
- State 0: 10799
- State 1: 749
- Max. segment length
- State 0: 1124499
- State 1: 680149
|
Intersection
|
st0 |
st1 |
total |
| Total bp |
13512144 |
8650730 |
22162874 |
| Fraction of SangerChip |
0.7788908 |
0.6915083 |
0.742279 |
| Fraction of AffyRnaSignal |
0.791007 |
0.7047171 |
0.7549262 |
SangerChip minus AffyRnaSignal
|
st0 |
st1 |
total |
| Total bp |
3835787 |
3859213 |
7695000 |
| Fraction of SangerChip |
0.2211092 |
0.3084917 |
0.2577210 |
| Fraction of AffyRnaSignal |
0.2245487 |
0.3143843 |
0.2621121 |
AffyRnaSignal minus SangerChip
|
st0 |
st1 |
both |
| Total bp |
3570061 |
3624734 |
7194795 |
| Fraction of SangerChip |
0.2057917 |
0.2897482 |
0.2409681 |
| Fraction of AffyRnaSignal |
0.208993 |
0.2952829 |
0.2450738 |
Symmetric difference
|
st0 |
st1 |
| Total bp |
7405848 |
7483947 |
| Fraction of SangerChip |
0.4269009 |
0.5982399 |
| Fraction of AffyRnaSignal |
0.4335417 |
0.6096671 |
|


