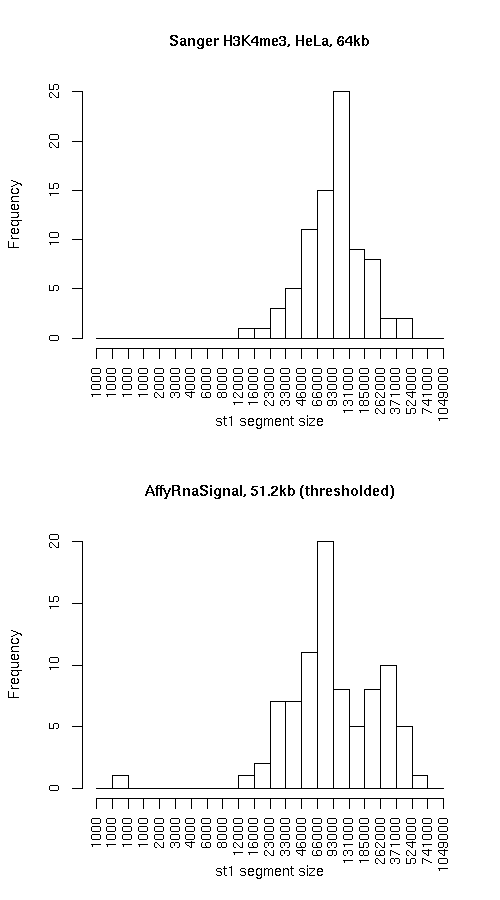
Histogram of active state (st1) segment lengths
|
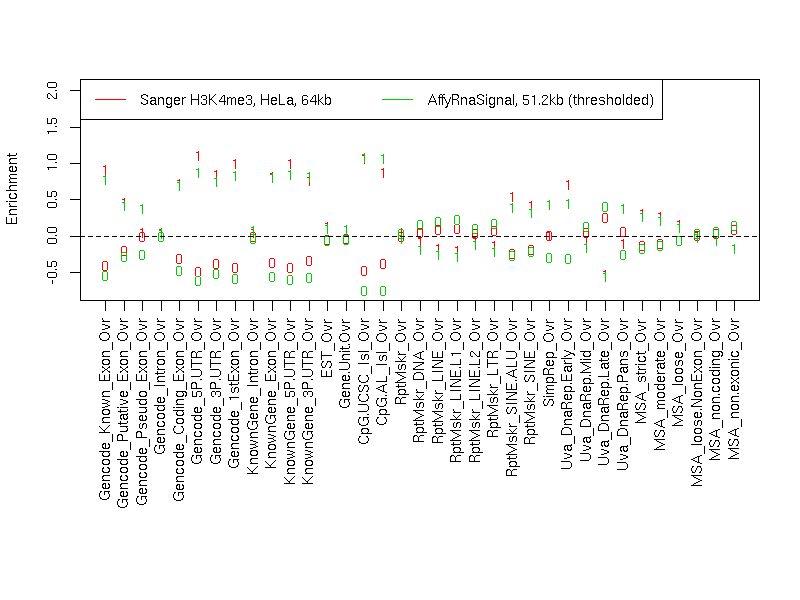
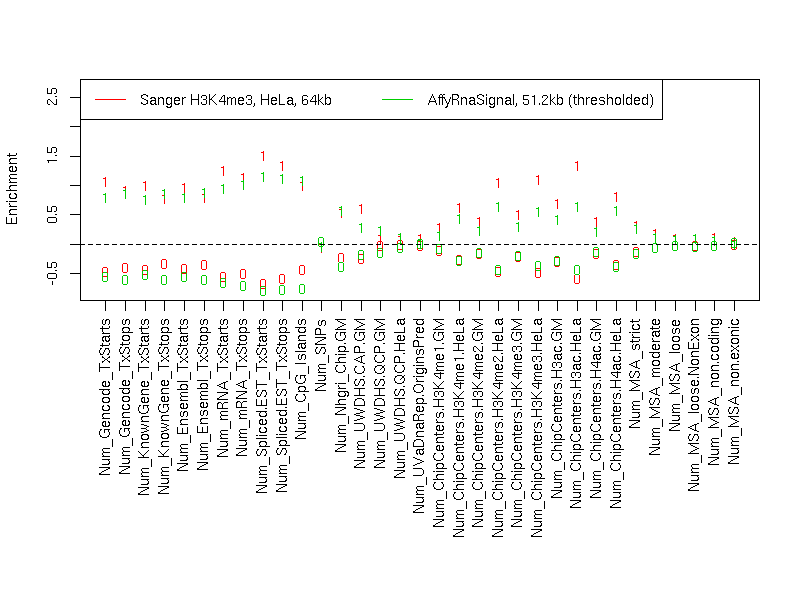
Individual segmentation statistics
| Sanger H3K4me3, HeLa, 64kb |
AffyRnaSignal, 51.2kb (thresholded) |
- Number of segments
- Total size (bp)
- State 0: 20489899
- State 1: 9367918
- Avg. segment length
- State 0: 202870
- State 1: 114243
- Median segment length
- State 0: 122999
- State 1: 99999
- Min. segment length
- State 0: 8999
- State 1: 13999
- Max. segment length
- State 0: 1038999
- State 1: 423999
|
- Number of segments
- Total size (bp)
- State 0: 17082205
- State 1: 12275464
- Avg. segment length
- State 0: 179813
- State 1: 142738
- Median segment length
- State 0: 111399
- State 1: 84099
- Min. segment length
- State 0: 10799
- State 1: 749
- Max. segment length
- State 0: 1124499
- State 1: 680149
|
Intersection
|
st0 |
st1 |
total |
| Total bp |
14001158 |
6050981 |
20052139 |
| Fraction of SangerChip |
0.68332 |
0.6459259 |
0.6715876 |
| Fraction of AffyRnaSignal |
0.8196341 |
0.492933 |
0.683029 |
SangerChip minus AffyRnaSignal
|
st0 |
st1 |
total |
| Total bp |
6488741 |
3316937 |
9805678 |
| Fraction of SangerChip |
0.31668 |
0.3540741 |
0.3284124 |
| Fraction of AffyRnaSignal |
0.3798538 |
0.2702087 |
0.3340074 |
AffyRnaSignal minus SangerChip
|
st0 |
st1 |
both |
| Total bp |
3081047 |
6224483 |
9305530 |
| Fraction of SangerChip |
0.1503691 |
0.6644468 |
0.3116614 |
| Fraction of AffyRnaSignal |
0.1803659 |
0.507067 |
0.316971 |
Symmetric difference
|
st0 |
st1 |
| Total bp |
9569788 |
9541420 |
| Fraction of SangerChip |
0.4670491 |
1.018521 |
| Fraction of AffyRnaSignal |
0.5602197 |
0.7772757 |
|