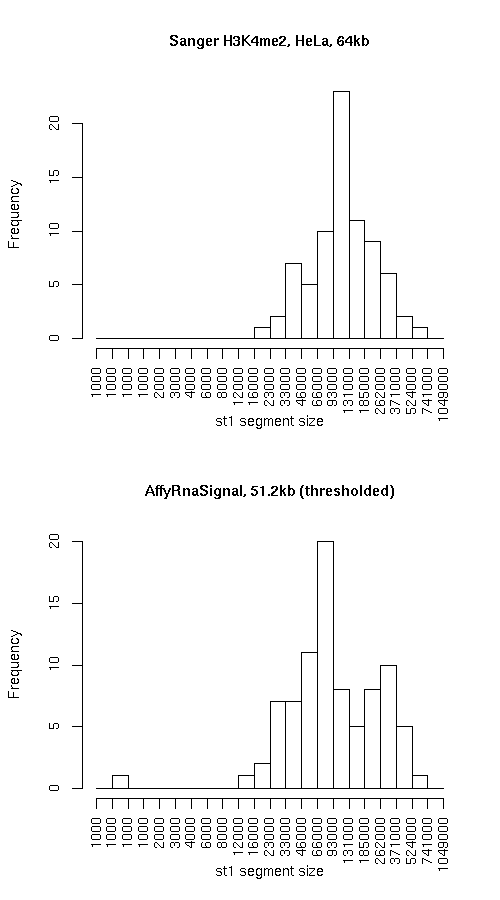
Histogram of active state (st1) segment lengths
|
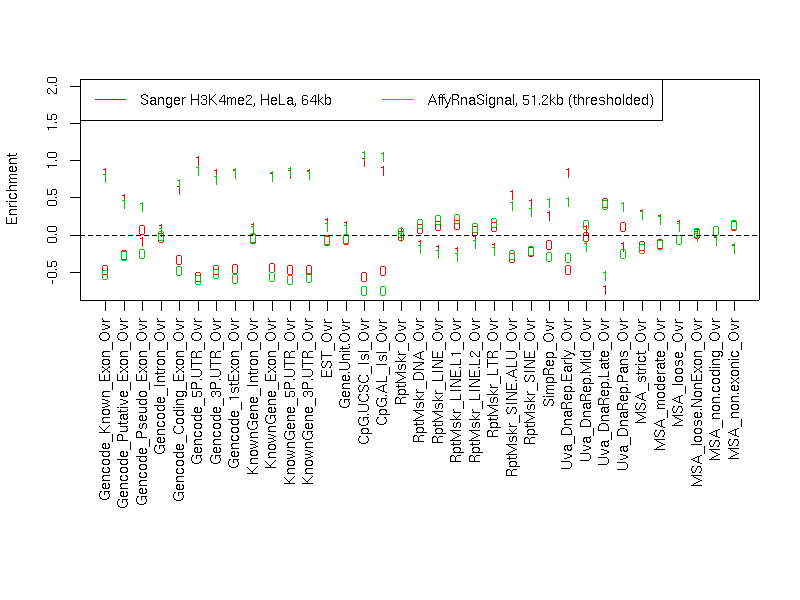
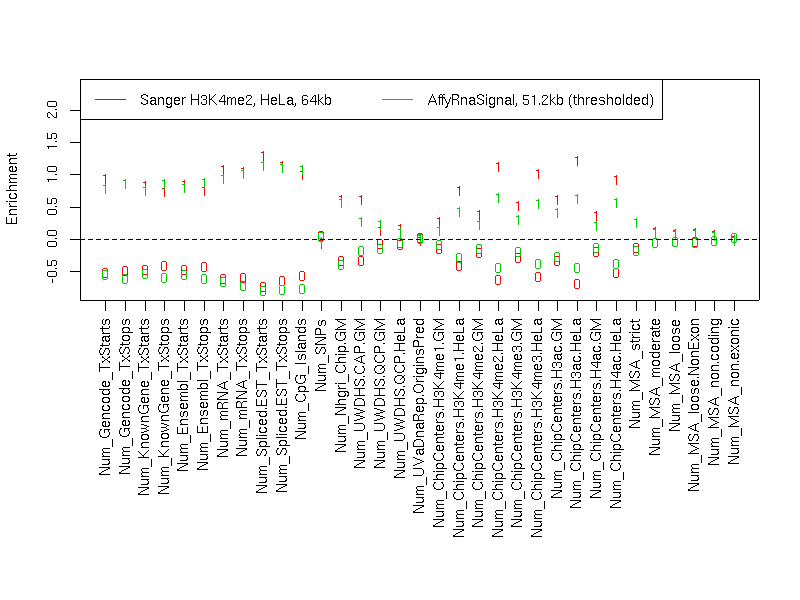
Individual segmentation statistics
| Sanger H3K4me2, HeLa, 64kb |
AffyRnaSignal, 51.2kb (thresholded) |
- Number of segments
- Total size (bp)
- State 0: 18940905
- State 1: 10916923
- Avg. segment length
- State 0: 199378
- State 1: 141778
- Median segment length
- State 0: 110999
- State 1: 108999
- Min. segment length
- State 0: 6999
- State 1: 17999
- Max. segment length
- State 0: 1031999
- State 1: 629999
|
- Number of segments
- Total size (bp)
- State 0: 17082205
- State 1: 12275464
- Avg. segment length
- State 0: 179813
- State 1: 142738
- Median segment length
- State 0: 111399
- State 1: 84099
- Min. segment length
- State 0: 10799
- State 1: 749
- Max. segment length
- State 0: 1124499
- State 1: 680149
|
Intersection
|
st0 |
st1 |
total |
| Total bp |
13733089 |
7333058 |
21066147 |
| Fraction of SangerChip |
0.7250493 |
0.6717147 |
0.7055485 |
| Fraction of AffyRnaSignal |
0.8039412 |
0.5973752 |
0.7175688 |
SangerChip minus AffyRnaSignal
|
st0 |
st1 |
total |
| Total bp |
5207816 |
3583865 |
8791681 |
| Fraction of SangerChip |
0.2749507 |
0.3282853 |
0.2944515 |
| Fraction of AffyRnaSignal |
0.3048679 |
0.2919535 |
0.2994680 |
AffyRnaSignal minus SangerChip
|
st0 |
st1 |
both |
| Total bp |
3349116 |
4942406 |
8291522 |
| Fraction of SangerChip |
0.1768192 |
0.4527289 |
0.2777001 |
| Fraction of AffyRnaSignal |
0.1960588 |
0.4026248 |
0.2824312 |
Symmetric difference
|
st0 |
st1 |
| Total bp |
8556932 |
8526271 |
| Fraction of SangerChip |
0.45177 |
0.7810141 |
| Fraction of AffyRnaSignal |
0.5009267 |
0.6945783 |
|