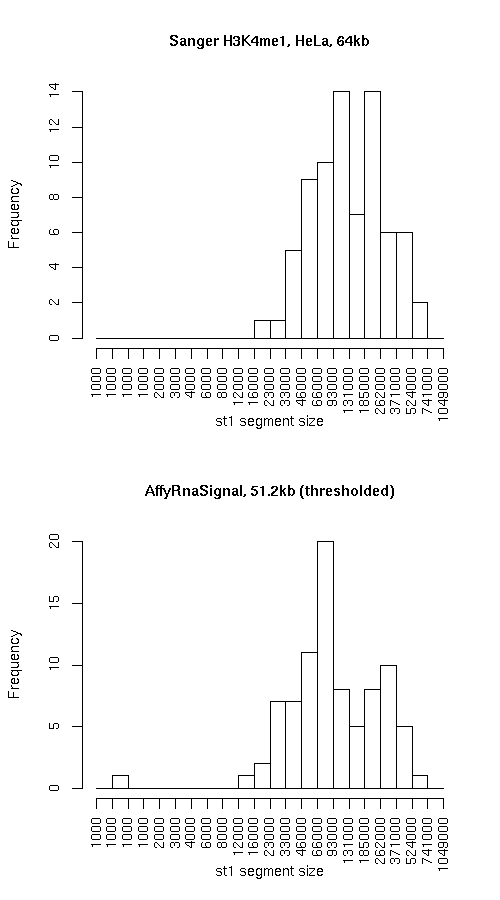
Histogram of active state (st1) segment lengths
|
Individual segmentation statistics
| Sanger H3K4me1, HeLa, 64kb |
AffyRnaSignal, 51.2kb (thresholded) |
- Number of segments
- Total size (bp)
- State 0: 17014912
- State 1: 12842925
- Avg. segment length
- State 0: 193351
- State 1: 171239
- Median segment length
- State 0: 118499
- State 1: 125999
- Min. segment length
- State 0: 16999
- State 1: 18999
- Max. segment length
- State 0: 998999
- State 1: 575999
|
- Number of segments
- Total size (bp)
- State 0: 17082205
- State 1: 12275464
- Avg. segment length
- State 0: 179813
- State 1: 142738
- Median segment length
- State 0: 111399
- State 1: 84099
- Min. segment length
- State 0: 10799
- State 1: 749
- Max. segment length
- State 0: 1124499
- State 1: 680149
|
Intersection
|
st0 |
st1 |
total |
| Total bp |
12006062 |
7523858 |
19529920 |
| Fraction of SangerChip |
0.70562 |
0.5858368 |
0.654097 |
| Fraction of AffyRnaSignal |
0.7028403 |
0.6129184 |
0.6652408 |
SangerChip minus AffyRnaSignal
|
st0 |
st1 |
total |
| Total bp |
5008850 |
5319067 |
10327917 |
| Fraction of SangerChip |
0.29438 |
0.4141632 |
0.3459031 |
| Fraction of AffyRnaSignal |
0.2932203 |
0.4333088 |
0.3517962 |
AffyRnaSignal minus SangerChip
|
st0 |
st1 |
both |
| Total bp |
5076143 |
4751606 |
9827749 |
| Fraction of SangerChip |
0.2983350 |
0.3699785 |
0.3291514 |
| Fraction of AffyRnaSignal |
0.2971597 |
0.3870816 |
0.3347592 |
Symmetric difference
|
st0 |
st1 |
| Total bp |
10084993 |
10070673 |
| Fraction of SangerChip |
0.592715 |
0.7841417 |
| Fraction of AffyRnaSignal |
0.59038 |
0.8203904 |
|