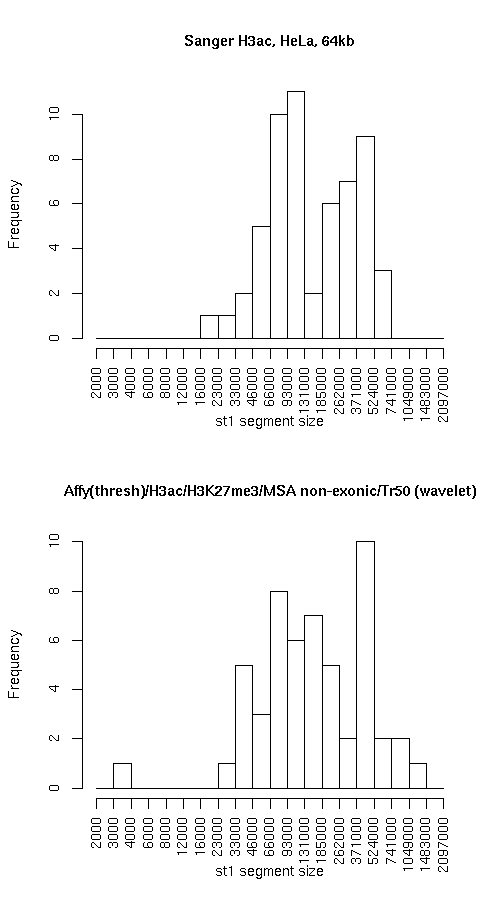
Compare segmentations, Sanger H3ac, HeLa, 64kb vs. Affy(thresh)/H3ac/H3K27me3/MSA non-exonic/Tr50 (wavelet)

Histogram of active state (st1) segment lengths

Individual segmentation statistics

Sanger H3ac, HeLa, 64kb Affy(thresh)/H3ac/H3K27me3/MSA non-exonic/Tr50 (wavelet)
  • Number of segments
    • State 0: 69
    • State 1: 57
  • Total size (bp)
    • State 0: 17347931
    • State 1: 12509943
  • Avg. segment length
    • State 0: 251419
    • State 1: 219473
  • Median segment length
    • State 0: 175999
    • State 1: 127999
  • Min. segment length
    • State 0: 14999
    • State 1: 20999
  • Max. segment length
    • State 0: 1036999
    • State 1: 737999
  • Number of segments
    • State 0: 61
    • State 1: 53
  • Total size (bp)
    • State 0: 16334939
    • State 1: 12922947
  • Avg. segment length
    • State 0: 267786
    • State 1: 243829
  • Median segment length
    • State 0: 175999
    • State 1: 140999
  • Min. segment length
    • State 0: 16999
    • State 1: 3999
  • Max. segment length
    • State 0: 1116999
    • State 1: 1099999

Intersection

st0 st1 total
Total bp 15277939 10914946 26192885
Fraction of SangerChip 0.8806779 0.8725017 0.8772522
Fraction of Affy.H3ac.H3K27me3.Tr50 0.935292 0.8446174 0.8952419

SangerChip minus Affy.H3ac.H3K27me3.Tr50

st0 st1 total
Total bp 2069992 1594997 3664989
Fraction of SangerChip 0.1193221 0.1274983 0.1227478
Fraction of Affy.H3ac.H3K27me3.Tr50 0.1267217 0.1234236 0.125265

Affy.H3ac.H3K27me3.Tr50 minus SangerChip

st0 st1 both
Total bp 1057000 2008001 3065001
Fraction of SangerChip 0.06092946 0.1605124 0.1026530
Fraction of Affy.H3ac.H3K27me3.Tr50 0.06470792 0.1553826 0.1047581

Symmetric difference

st0 st1
Total bp 3126992 3602998
Fraction of SangerChip 0.1802516 0.2880107
Fraction of Affy.H3ac.H3K27me3.Tr50 0.1914297 0.2788062

Enrichment of elements

Plots below indicate the relative enrichment, over the expected value, of various elements in each state, for each dataset. Enrichment values for state 0 are represented with "0"s and "1"s for state 1. Different colors are used for the different datasets.