- Number of segments
- Total size (bp)
- State 0: 16697602
- State 1: 12152304
- Avg. segment length
- State 0: 347867
- State 1: 264181
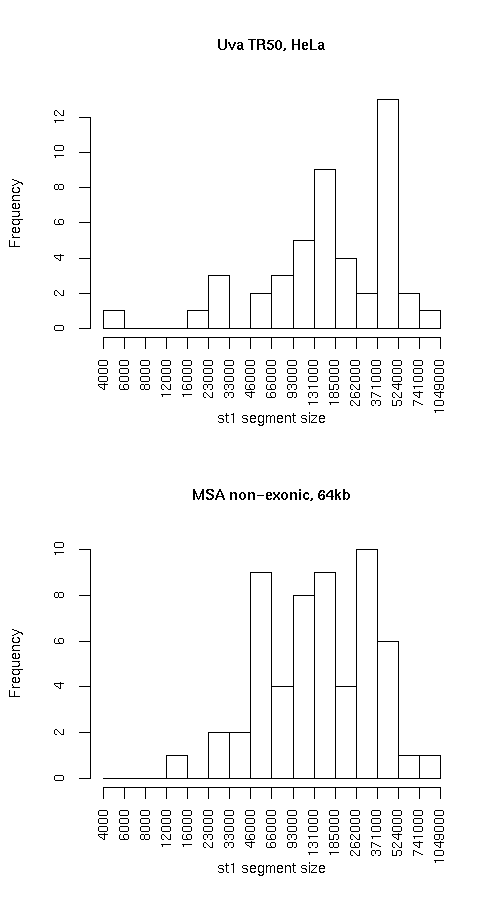
- Median segment length
- State 0: 334499
- State 1: 180349
- Min. segment length
- State 0: 6699
- State 1: 4499
- Max. segment length
- State 0: 1617849
- State 1: 746949
|
- Number of segments
- Total size (bp)
- State 0: 18317635
- State 1: 11680425
- Avg. segment length
- State 0: 254412
- State 1: 204920
- Median segment length
- State 0: 149000
- State 1: 146000
- Min. segment length
- State 0: 22000
- State 1: 14000
- Max. segment length
- State 0: 1353000
- State 1: 1000000
|