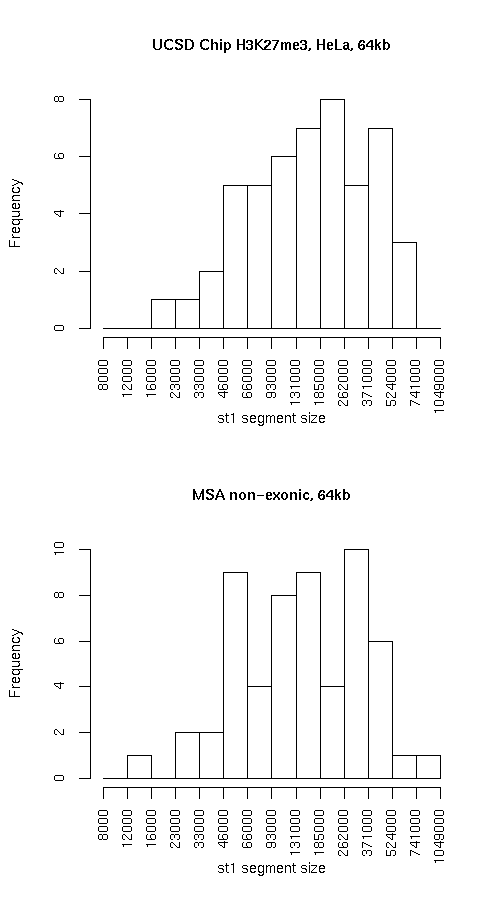
Histogram of active state (st1) segment lengths
|
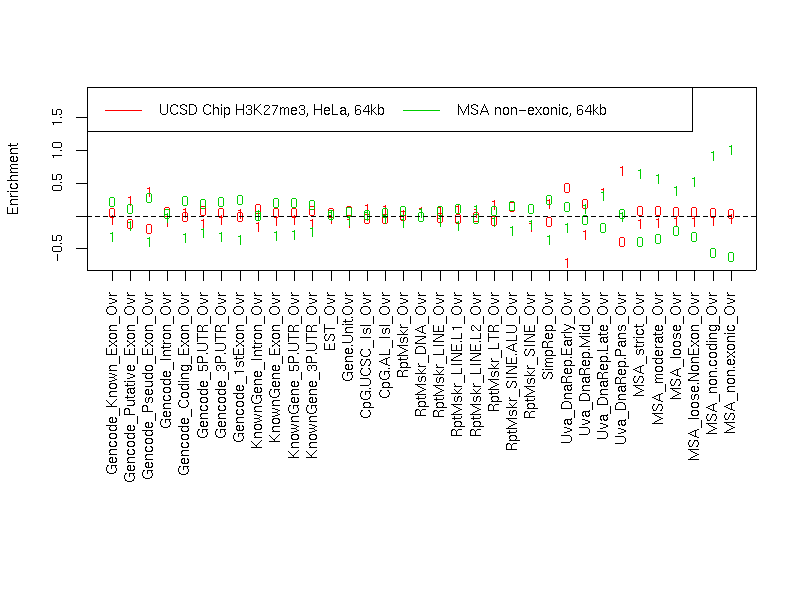
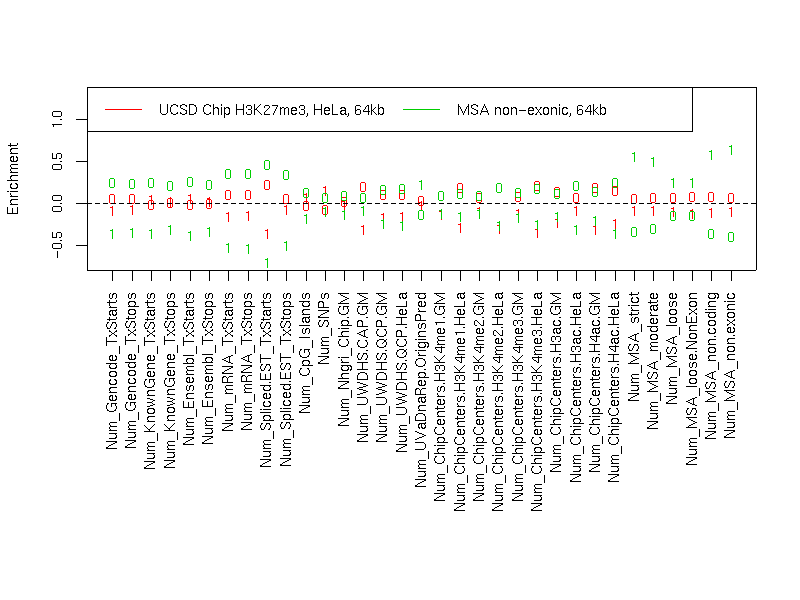
Individual segmentation statistics
| UCSD Chip H3K27me3, HeLa, 64kb |
MSA non-exonic, 64kb |
- Number of segments
- Total size (bp)
- State 0: 18907441
- State 1: 10964950
- Avg. segment length
- State 0: 320465
- State 1: 219299
- Median segment length
- State 0: 305499
- State 1: 152249
- Min. segment length
- State 0: 16999
- State 1: 16999
- Max. segment length
- State 0: 1610499
- State 1: 661999
|
- Number of segments
- Total size (bp)
- State 0: 18317635
- State 1: 11680425
- Avg. segment length
- State 0: 254412
- State 1: 204920
- Median segment length
- State 0: 149000
- State 1: 146000
- Min. segment length
- State 0: 22000
- State 1: 14000
- Max. segment length
- State 0: 1353000
- State 1: 1000000
|
Intersection
|
st0 |
st1 |
total |
| Total bp |
11666641 |
4412578 |
16079219 |
| Fraction of UcsdChip |
0.6170397 |
0.4024257 |
0.5382635 |
| Fraction of MSA |
0.6369076 |
0.3777755 |
0.5360086 |
UcsdChip minus MSA
|
st0 |
st1 |
total |
| Total bp |
7240800 |
6552372 |
13793172 |
| Fraction of UcsdChip |
0.3829603 |
0.5975743 |
0.4617365 |
| Fraction of MSA |
0.3952912 |
0.5609703 |
0.4598021 |
MSA minus UcsdChip
|
st0 |
st1 |
both |
| Total bp |
6650994 |
7267847 |
13918841 |
| Fraction of UcsdChip |
0.3517660 |
0.6628254 |
0.4659433 |
| Fraction of MSA |
0.3630924 |
0.6222245 |
0.4639914 |
Symmetric difference
|
st0 |
st1 |
| Total bp |
13891794 |
13820219 |
| Fraction of UcsdChip |
0.7347263 |
1.260400 |
| Fraction of MSA |
0.7583836 |
1.183195 |
|