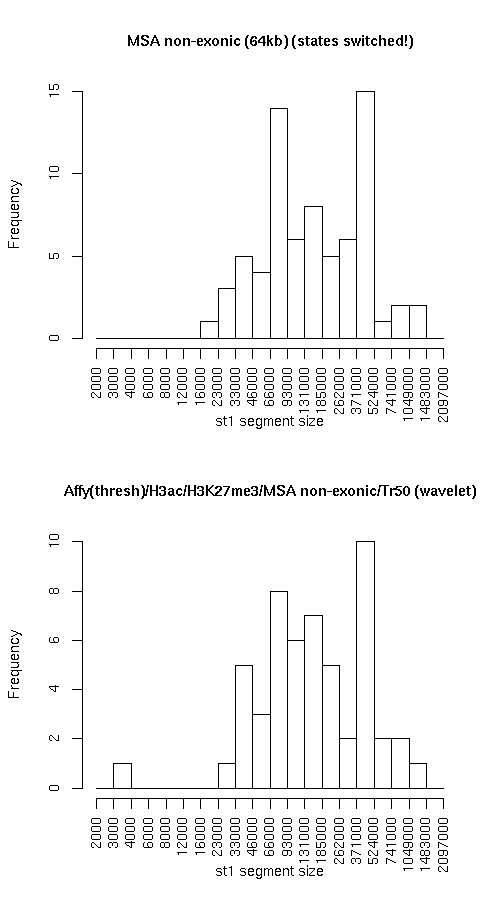
Compare segmentations, MSA non-exonic (64kb) (states switched!) vs. Affy(thresh)/H3ac/H3K27me3/MSA non-exonic/Tr50 (wavelet)
Histogram of active state (st1) segment lengths
Individual segmentation statistics
MSA non-exonic (64kb) (states switched!) Affy(thresh)/H3ac/H3K27me3/MSA non-exonic/Tr50 (wavelet)
- Number of segments
- State 0: 57
- State 1: 72
- Total size (bp)
- State 0: 11680425
- State 1: 18317635
- Avg. segment length
- State 0: 204920
- State 1: 254412
- Median segment length
- State 0: 146000
- State 1: 149000
- Min. segment length
- State 0: 14000
- State 1: 22000
- Max. segment length
- State 0: 1000000
- State 1: 1353000
- Number of segments
- State 0: 61
- State 1: 53
- Total size (bp)
- State 0: 16334939
- State 1: 12922947
- Avg. segment length
- State 0: 267786
- State 1: 243829
- Median segment length
- State 0: 175999
- State 1: 140999
- Min. segment length
- State 0: 16999
- State 1: 3999
- Max. segment length
- State 0: 1116999
- State 1: 1099999
Intersection
st0 st1 total Total bp 8489004 9762289 18251293 Fraction of MSA 0.7267718 0.5329448 0.6084158 Fraction of Affy.H3ac.H3K27me3.Tr50 0.5196839 0.7554228 0.6238076
MSA minus Affy.H3ac.H3K27me3.Tr50
st0 st1 total Total bp 3191421 8555346 11746767 Fraction of MSA 0.2732282 0.4670552 0.3915842 Fraction of Affy.H3ac.H3K27me3.Tr50 0.1953739 0.6620275 0.4014906
Affy.H3ac.H3K27me3.Tr50 minus MSA
st0 st1 both Total bp 7845935 3160658 11006593 Fraction of MSA 0.6717166 0.1725473 0.3669102 Fraction of Affy.H3ac.H3K27me3.Tr50 0.4803161 0.2445772 0.3761924
Symmetric difference
st0 st1 Total bp 11037356 11716004 Fraction of MSA 0.9449447 0.6396024 Fraction of Affy.H3ac.H3K27me3.Tr50 0.67569 0.9066047 Enrichment of elements
Plots below indicate the relative enrichment, over the expected value, of various elements in each state, for each dataset. Enrichment values for state 0 are represented with "0"s and "1"s for state 1. Different colors are used for the different datasets.