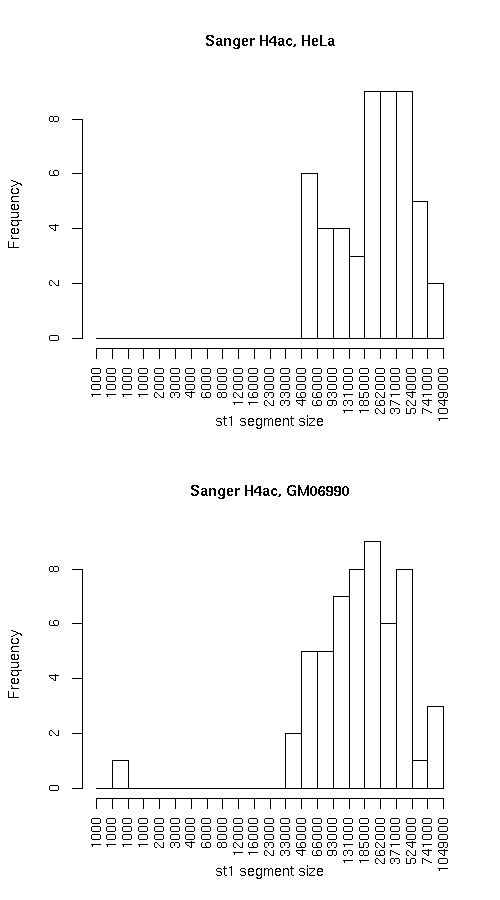
Compare segmentations, Sanger H4ac, HeLa vs. Sanger H4ac, GM06990

Histogram of active state (st1) segment lengths

Individual segmentation statistics

Sanger H4ac, HeLa Sanger H4ac, GM06990
  • Number of segments
    • State 0: 59
    • State 1: 51
  • Total size (bp)
    • State 0: 14217941
    • State 1: 15618949
  • Avg. segment length
    • State 0: 240982
    • State 1: 306254
  • Median segment length
    • State 0: 204999
    • State 1: 254999
  • Min. segment length
    • State 0: 10999
    • State 1: 49999
  • Max. segment length
    • State 0: 817999
    • State 1: 915999
  • Number of segments
    • State 0: 61
    • State 1: 55
  • Total size (bp)
    • State 0: 16279939
    • State 1: 13577945
  • Avg. segment length
    • State 0: 266884
    • State 1: 246872
  • Median segment length
    • State 0: 183999
    • State 1: 183999
  • Min. segment length
    • State 0: 22999
    • State 1: 999
  • Max. segment length
    • State 0: 998999
    • State 1: 899999

Intersection

st0 st1 total
Total bp 11721647 11072121 22793768
Fraction of GM 0.8244265 0.7088903 0.7639458
Fraction of HeLa 0.7200056 0.815449 0.7634087

GM minus HeLa

st0 st1 total
Total bp 2496294 4546828 7043122
Fraction of GM 0.1755735 0.2911097 0.2360542
Fraction of HeLa 0.1533356 0.3348686 0.2358882

HeLa minus GM

st0 st1 both
Total bp 4558292 2505824 7064116
Fraction of GM 0.3206014 0.1604349 0.2367578
Fraction of HeLa 0.2799944 0.1845510 0.2365913

Symmetric difference

st0 st1
Total bp 7054586 7052652
Fraction of GM 0.4961749 0.4515446
Fraction of HeLa 0.43333 0.5194197

Enrichment of elements

Plots below indicate the relative enrichment, over the expected value, of various elements in each state, for each dataset. Enrichment values for state 0 are represented with "0"s and "1"s for state 1. Different colors are used for the different datasets.