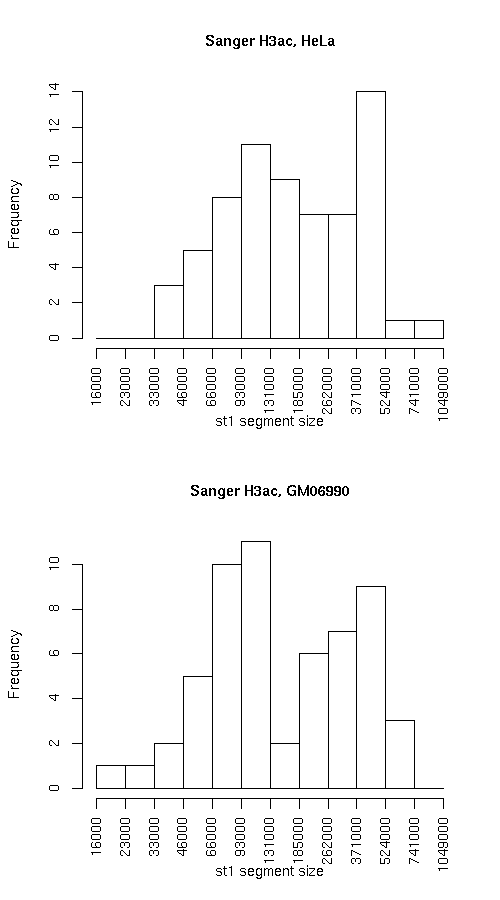
Compare segmentations, Sanger H3ac, HeLa vs. Sanger H3ac, GM06990
Histogram of active state (st1) segment lengths
Individual segmentation statistics
Sanger H3ac, HeLa Sanger H3ac, GM06990
- Number of segments
- State 0: 64
- State 1: 66
- Total size (bp)
- State 0: 14262936
- State 1: 15574934
- Avg. segment length
- State 0: 222858
- State 1: 235984
- Median segment length
- State 0: 149499
- State 1: 167999
- Min. segment length
- State 0: 25999
- State 1: 34999
- Max. segment length
- State 0: 878999
- State 1: 912999
- Number of segments
- State 0: 69
- State 1: 57
- Total size (bp)
- State 0: 17347931
- State 1: 12509943
- Avg. segment length
- State 0: 251419
- State 1: 219473
- Median segment length
- State 0: 175999
- State 1: 127999
- Min. segment length
- State 0: 14999
- State 1: 20999
- Max. segment length
- State 0: 1036999
- State 1: 737999
Intersection
st0 st1 total Total bp 11578819 9824115 21402934 Fraction of GM 0.8118117 0.6307645 0.7173077 Fraction of HeLa 0.6674467 0.7853045 0.7168271
GM minus HeLa
st0 st1 total Total bp 2684117 5750819 8434936 Fraction of GM 0.1881883 0.3692355 0.2826923 Fraction of HeLa 0.1547226 0.4596999 0.2825029
HeLa minus GM
st0 st1 both Total bp 5769112 2685828 8454940 Fraction of GM 0.4044828 0.1724455 0.2833627 Fraction of HeLa 0.3325533 0.2146955 0.2831729
Symmetric difference
st0 st1 Total bp 8453229 8436647 Fraction of GM 0.592671 0.5416811 Fraction of HeLa 0.4872759 0.6743953 Enrichment of elements
Plots below indicate the relative enrichment, over the expected value, of various elements in each state, for each dataset. Enrichment values for state 0 are represented with "0"s and "1"s for state 1. Different colors are used for the different datasets.