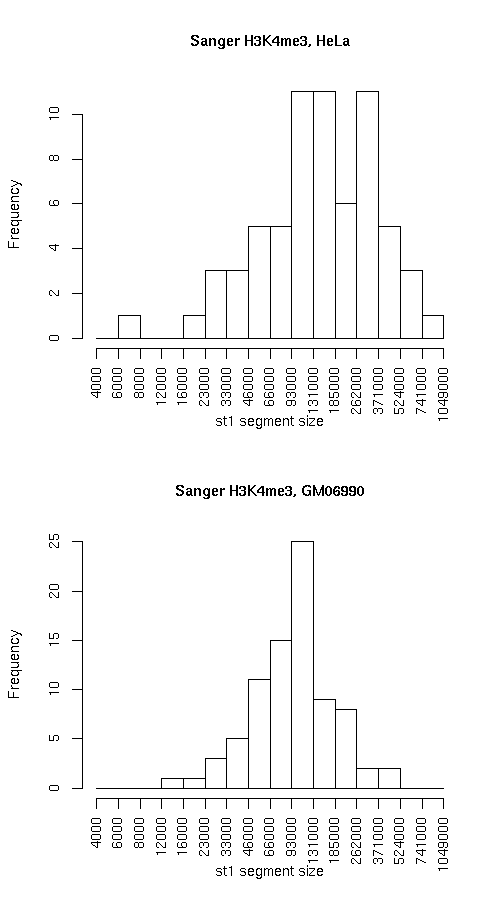
Compare segmentations, Sanger H3K4me3, HeLa vs. Sanger H3K4me3, GM06990
Histogram of active state (st1) segment lengths
Individual segmentation statistics
Sanger H3K4me3, HeLa Sanger H3K4me3, GM06990
- Number of segments
- State 0: 80
- State 1: 66
- Total size (bp)
- State 0: 16425920
- State 1: 13407934
- Avg. segment length
- State 0: 205324
- State 1: 203151
- Median segment length
- State 0: 129499
- State 1: 143999
- Min. segment length
- State 0: 10999
- State 1: 7999
- Max. segment length
- State 0: 827999
- State 1: 834999
- Number of segments
- State 0: 101
- State 1: 82
- Total size (bp)
- State 0: 20489899
- State 1: 9367918
- Avg. segment length
- State 0: 202870
- State 1: 114243
- Median segment length
- State 0: 122999
- State 1: 99999
- Min. segment length
- State 0: 8999
- State 1: 13999
- Max. segment length
- State 0: 1038999
- State 1: 423999
Intersection
st0 st1 total Total bp 15221614 8162931 23384545 Fraction of GM 0.9266826 0.6088135 0.7838258 Fraction of HeLa 0.7428838 0.8713709 0.7831967
GM minus HeLa
st0 st1 total Total bp 1204306 5245003 6449309 Fraction of GM 0.07331742 0.3911865 0.2161742 Fraction of HeLa 0.0587756 0.5598899 0.2160007
HeLa minus GM
st0 st1 both Total bp 5268285 1204987 6473272 Fraction of GM 0.32073 0.0898712 0.2169774 Fraction of HeLa 0.2571162 0.1286291 0.2168033
Symmetric difference
st0 st1 Total bp 6472591 6449990 Fraction of GM 0.3940474 0.4810577 Fraction of HeLa 0.3158918 0.688519 Enrichment of elements
Plots below indicate the relative enrichment, over the expected value, of various elements in each state, for each dataset. Enrichment values for state 0 are represented with "0"s and "1"s for state 1. Different colors are used for the different datasets.