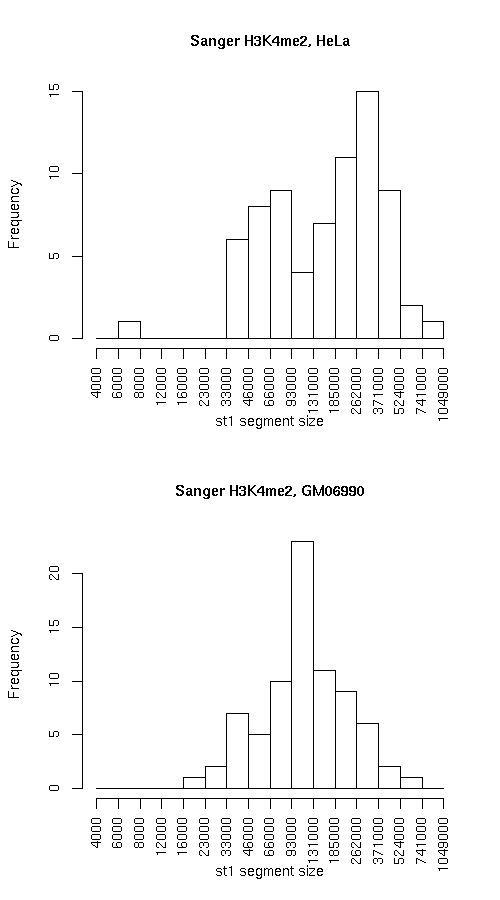
Compare segmentations, Sanger H3K4me2, HeLa vs. Sanger H3K4me2, GM06990

Histogram of active state (st1) segment lengths

Individual segmentation statistics

Sanger H3K4me2, HeLa Sanger H3K4me2, GM06990
  • Number of segments
    • State 0: 81
    • State 1: 73
  • Total size (bp)
    • State 0: 13554919
    • State 1: 16281927
  • Avg. segment length
    • State 0: 167345
    • State 1: 223040
  • Median segment length
    • State 0: 103999
    • State 1: 203999
  • Min. segment length
    • State 0: 13999
    • State 1: 7999
  • Max. segment length
    • State 0: 818999
    • State 1: 944999
  • Number of segments
    • State 0: 95
    • State 1: 77
  • Total size (bp)
    • State 0: 18940905
    • State 1: 10916923
  • Avg. segment length
    • State 0: 199378
    • State 1: 141778
  • Median segment length
    • State 0: 110999
    • State 1: 108999
  • Min. segment length
    • State 0: 6999
    • State 1: 17999
  • Max. segment length
    • State 0: 1031999
    • State 1: 629999

Intersection

st0 st1 total
Total bp 12608570 9965741 22574311
Fraction of GM 0.930184 0.6120738 0.7565917
Fraction of HeLa 0.6656794 0.9128709 0.75606

GM minus HeLa

st0 st1 total
Total bp 946349 6316186 7262535
Fraction of GM 0.06981591 0.3879262 0.2434083
Fraction of HeLa 0.04996324 0.5785683 0.2432372

HeLa minus GM

st0 st1 both
Total bp 6332335 951182 7283517
Fraction of GM 0.4671614 0.0584195 0.2441115
Fraction of HeLa 0.3343206 0.08712913 0.2439399

Symmetric difference

st0 st1
Total bp 7278684 7267368
Fraction of GM 0.5369773 0.4463457
Fraction of HeLa 0.3842839 0.6656975

Enrichment of elements

Plots below indicate the relative enrichment, over the expected value, of various elements in each state, for each dataset. Enrichment values for state 0 are represented with "0"s and "1"s for state 1. Different colors are used for the different datasets.