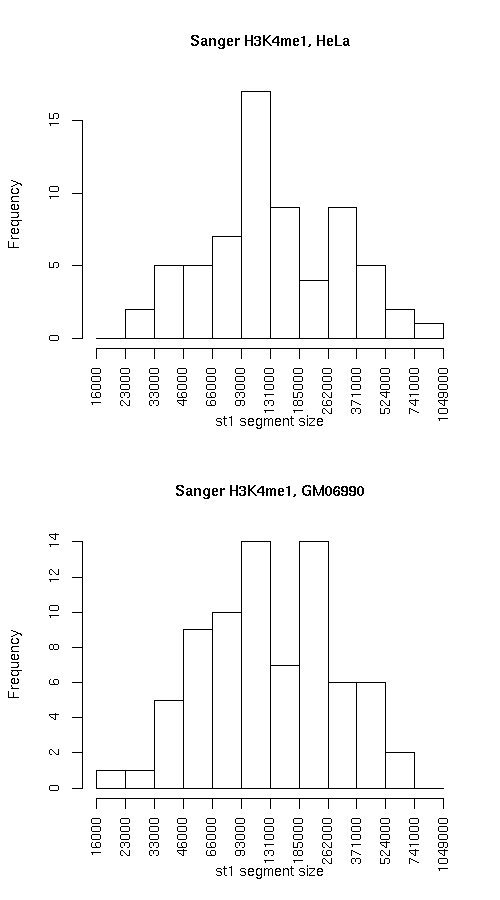
Compare segmentations, Sanger H3K4me1, HeLa vs. Sanger H3K4me1, GM06990

Histogram of active state (st1) segment lengths

Individual segmentation statistics

Sanger H3K4me1, HeLa Sanger H3K4me1, GM06990
  • Number of segments
    • State 0: 81
    • State 1: 66
  • Total size (bp)
    • State 0: 17339919
    • State 1: 12502934
  • Avg. segment length
    • State 0: 214073
    • State 1: 189438
  • Median segment length
    • State 0: 151999
    • State 1: 120999
  • Min. segment length
    • State 0: 11999
    • State 1: 27999
  • Max. segment length
    • State 0: 846999
    • State 1: 930999
  • Number of segments
    • State 0: 88
    • State 1: 75
  • Total size (bp)
    • State 0: 17014912
    • State 1: 12842925
  • Avg. segment length
    • State 0: 193351
    • State 1: 171239
  • Median segment length
    • State 0: 118499
    • State 1: 125999
  • Min. segment length
    • State 0: 16999
    • State 1: 18999
  • Max. segment length
    • State 0: 998999
    • State 1: 575999

Intersection

st0 st1 total
Total bp 12522551 8025747 20548298
Fraction of GM 0.7221805 0.6419091 0.68855
Fraction of HeLa 0.735975 0.6249158 0.6882045

GM minus HeLa

st0 st1 total
Total bp 4817368 4477187 9294555
Fraction of GM 0.2778195 0.3580909 0.3114499
Fraction of HeLa 0.2831262 0.3486112 0.3112936

HeLa minus GM

st0 st1 both
Total bp 4492361 4817178 9309539
Fraction of GM 0.2590762 0.3852838 0.3119520
Fraction of HeLa 0.2640249 0.3750842 0.3117955

Symmetric difference

st0 st1
Total bp 9309729 9294365
Fraction of GM 0.5368958 0.7433747
Fraction of HeLa 0.5471512 0.7236953

Enrichment of elements

Plots below indicate the relative enrichment, over the expected value, of various elements in each state, for each dataset. Enrichment values for state 0 are represented with "0"s and "1"s for state 1. Different colors are used for the different datasets.