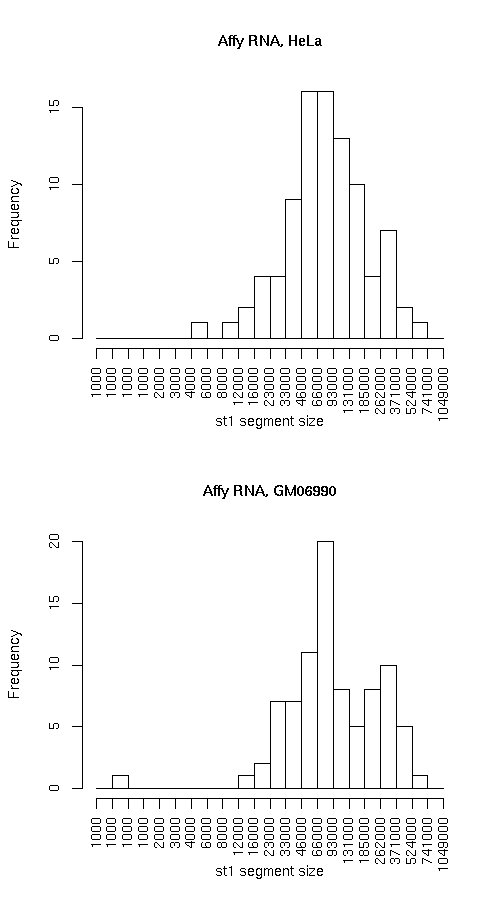
Compare segmentations, Affy RNA, HeLa vs. Affy RNA, GM06990

Histogram of active state (st1) segment lengths

Individual segmentation statistics

Affy RNA, HeLa Affy RNA, GM06990
  • Number of segments
    • State 0: 104
    • State 1: 90
  • Total size (bp)
    • State 0: 19236546
    • State 1: 10121110
  • Avg. segment length
    • State 0: 184967
    • State 1: 112457
  • Median segment length
    • State 0: 96124
    • State 1: 82274
  • Min. segment length
    • State 0: 1399
    • State 1: 4249
  • Max. segment length
    • State 0: 881399
    • State 1: 670599
  • Number of segments
    • State 0: 95
    • State 1: 86
  • Total size (bp)
    • State 0: 17082205
    • State 1: 12275464
  • Avg. segment length
    • State 0: 179813
    • State 1: 142738
  • Median segment length
    • State 0: 111399
    • State 1: 84099
  • Min. segment length
    • State 0: 10799
    • State 1: 749
  • Max. segment length
    • State 0: 1124499
    • State 1: 680149

Intersection

st0 st1 total
Total bp 15321850 8360770 23682620
Fraction of GM 0.796497 0.8260724 0.8066932
Fraction of HeLa 0.896948 0.681096 0.8066928

GM minus HeLa

st0 st1 total
Total bp 3914696 1760340 5675036
Fraction of GM 0.2035031 0.1739276 0.1933068
Fraction of HeLa 0.2291681 0.1434031 0.1933068

HeLa minus GM

st0 st1 both
Total bp 1760355 3914694 5675049
Fraction of GM 0.09151097 0.3867850 0.1933073
Fraction of HeLa 0.1030520 0.3189040 0.1933072

Symmetric difference

st0 st1
Total bp 5675051 5675034
Fraction of GM 0.2950140 0.5607126
Fraction of HeLa 0.3322201 0.4623071

Enrichment of elements

Plots below indicate the relative enrichment, over the expected value, of various elements in each state, for each dataset. Enrichment values for state 0 are represented with "0"s and "1"s for state 1. Different colors are used for the different datasets.