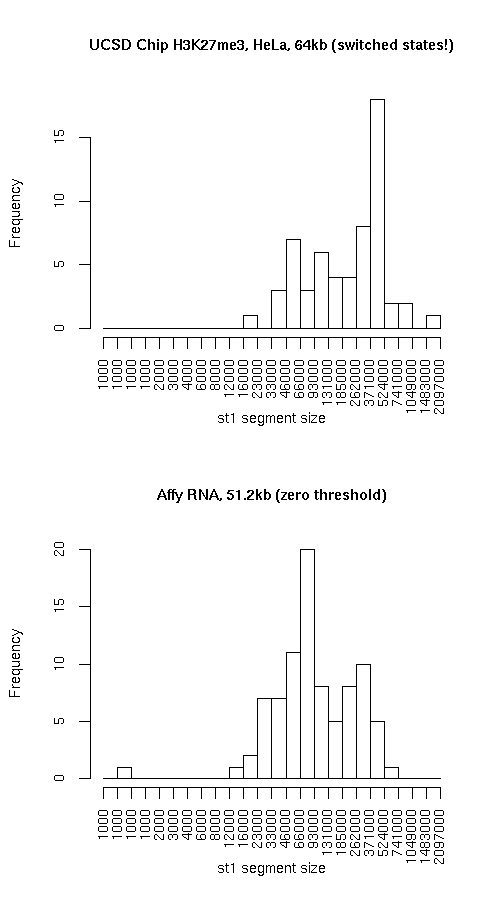
Histogram of active state (st1) segment lengths
|
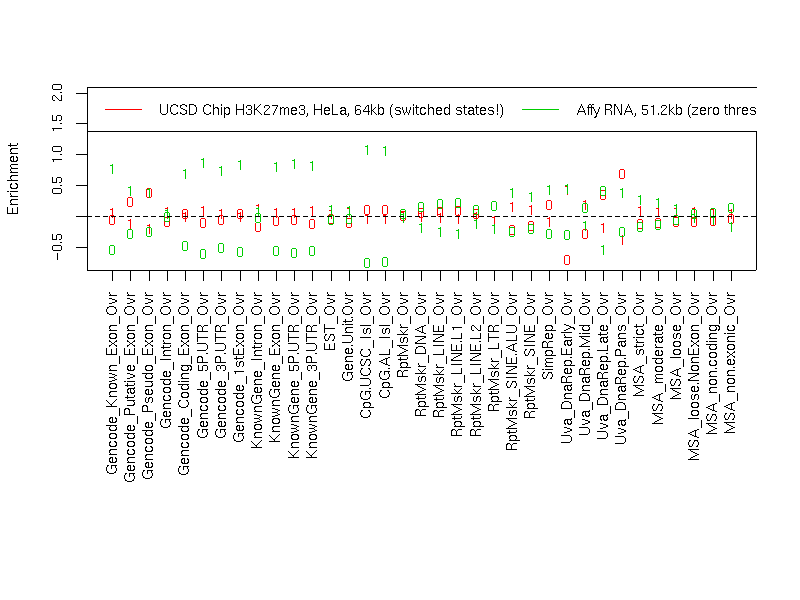
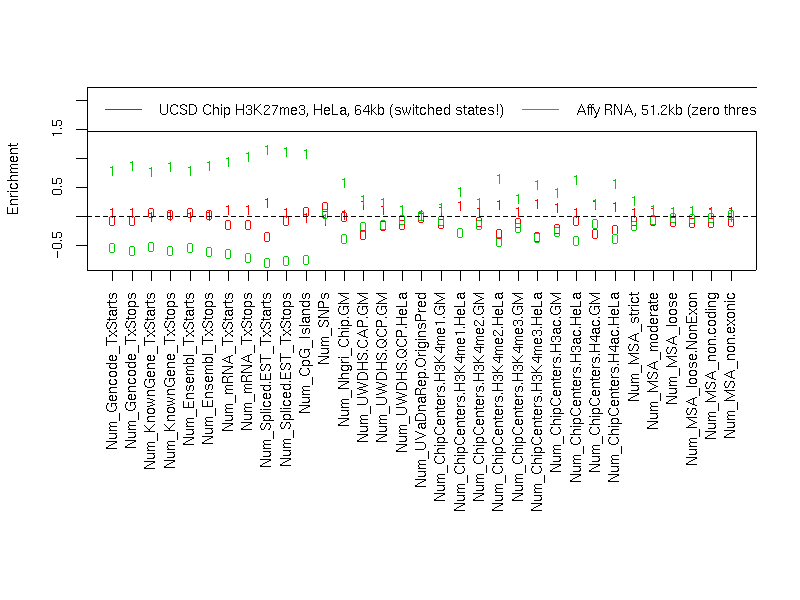
Individual segmentation statistics
| UCSD Chip H3K27me3, HeLa, 64kb (switched states!) |
Affy RNA, 51.2kb (zero threshold) |
- Number of segments
- Total size (bp)
- State 0: 10964950
- State 1: 18907441
- Avg. segment length
- State 0: 219299
- State 1: 320465
- Median segment length
- State 0: 152249
- State 1: 305499
- Min. segment length
- State 0: 16999
- State 1: 16999
- Max. segment length
- State 0: 661999
- State 1: 1610499
|
- Number of segments
- Total size (bp)
- State 0: 17082205
- State 1: 12275464
- Avg. segment length
- State 0: 179813
- State 1: 142738
- Median segment length
- State 0: 111399
- State 1: 84099
- Min. segment length
- State 0: 10799
- State 1: 749
- Max. segment length
- State 0: 1124499
- State 1: 680149
|
Intersection
|
st0 |
st1 |
total |
| Total bp |
6426869 |
8073161 |
14500030 |
| Fraction of UcsdChip |
0.5861284 |
0.4269833 |
0.485399 |
| Fraction of AffyRnaSignal |
0.3762318 |
0.6576665 |
0.4939094 |
UcsdChip minus AffyRnaSignal
|
st0 |
st1 |
total |
| Total bp |
4538081 |
10834280 |
15372361 |
| Fraction of UcsdChip |
0.4138716 |
0.5730167 |
0.514601 |
| Fraction of AffyRnaSignal |
0.2656613 |
0.8825964 |
0.5236234 |
AffyRnaSignal minus UcsdChip
|
st0 |
st1 |
both |
| Total bp |
10655336 |
4202303 |
14857639 |
| Fraction of UcsdChip |
0.9717633 |
0.2222566 |
0.4973703 |
| Fraction of AffyRnaSignal |
0.6237682 |
0.3423335 |
0.5060906 |
Symmetric difference
|
st0 |
st1 |
| Total bp |
15193417 |
15036583 |
| Fraction of UcsdChip |
1.385635 |
0.7952733 |
| Fraction of AffyRnaSignal |
0.8894295 |
1.22493 |
|