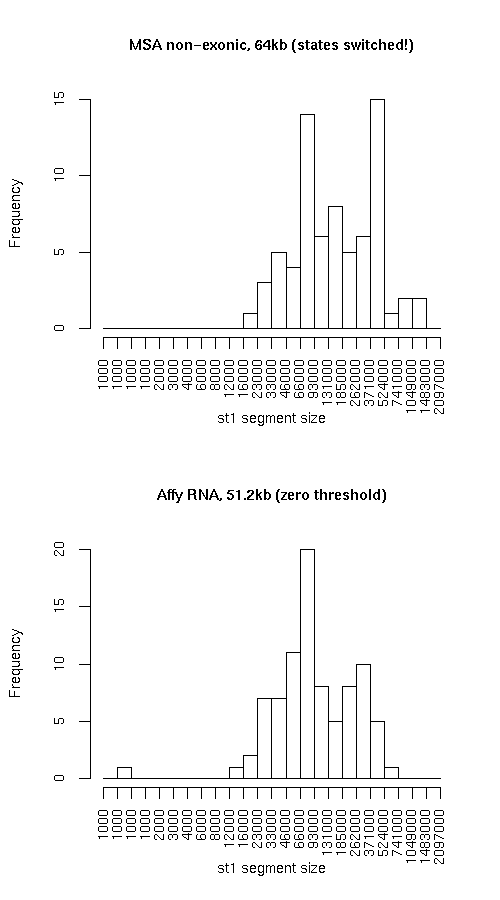
Compare segmentations, MSA non-exonic, 64kb (states switched!) vs. Affy RNA, 51.2kb (zero threshold)

Histogram of active state (st1) segment lengths

Individual segmentation statistics

MSA non-exonic, 64kb (states switched!) Affy RNA, 51.2kb (zero threshold)
  • Number of segments
    • State 0: 57
    • State 1: 72
  • Total size (bp)
    • State 0: 11680425
    • State 1: 18317635
  • Avg. segment length
    • State 0: 204920
    • State 1: 254412
  • Median segment length
    • State 0: 146000
    • State 1: 149000
  • Min. segment length
    • State 0: 14000
    • State 1: 22000
  • Max. segment length
    • State 0: 1000000
    • State 1: 1353000
  • Number of segments
    • State 0: 95
    • State 1: 86
  • Total size (bp)
    • State 0: 17082205
    • State 1: 12275464
  • Avg. segment length
    • State 0: 179813
    • State 1: 142738
  • Median segment length
    • State 0: 111399
    • State 1: 84099
  • Min. segment length
    • State 0: 10799
    • State 1: 749
  • Max. segment length
    • State 0: 1124499
    • State 1: 680149

Intersection

st0 st1 total
Total bp 8031214 8648237 16679451
Fraction of MSA 0.6875789 0.4721263 0.5560177
Fraction of AffyRnaSignal 0.4701509 0.704514 0.5681463

MSA minus AffyRnaSignal

st0 st1 total
Total bp 3649211 9669398 13318609
Fraction of MSA 0.3124211 0.5278737 0.4439823
Fraction of AffyRnaSignal 0.2136265 0.7877012 0.4536671

AffyRnaSignal minus MSA

st0 st1 both
Total bp 9050991 3627227 12678218
Fraction of MSA 0.7748854 0.1980183 0.4226346
Fraction of AffyRnaSignal 0.5298491 0.2954859 0.4318537

Symmetric difference

st0 st1
Total bp 12700202 13296625
Fraction of MSA 1.087306 0.725892
Fraction of AffyRnaSignal 0.7434756 1.083187

Enrichment of elements

Plots below indicate the relative enrichment, over the expected value, of various elements in each state, for each dataset. Enrichment values for state 0 are represented with "0"s and "1"s for state 1. Different colors are used for the different datasets.