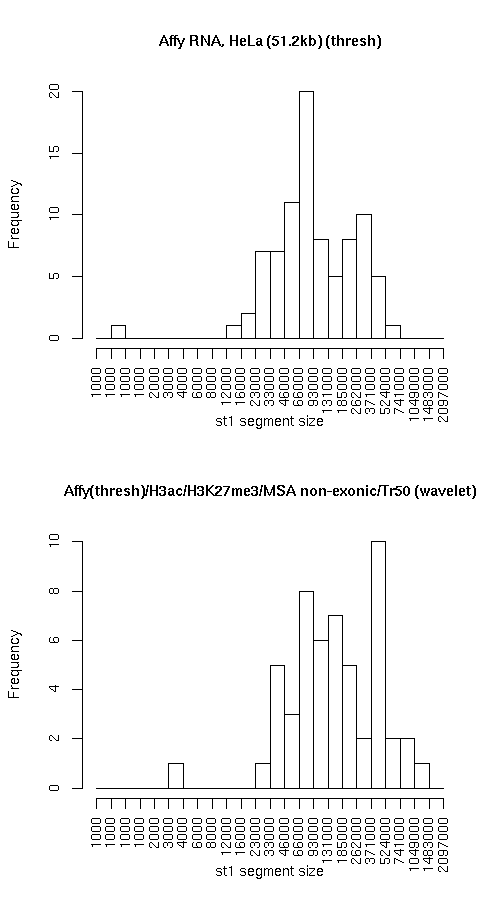
- Number of segments
- Total size (bp)
- State 0: 17082205
- State 1: 12275464
- Avg. segment length
- State 0: 179813
- State 1: 142738
- Median segment length
- State 0: 111399
- State 1: 84099
- Min. segment length
- State 0: 10799
- State 1: 749
- Max. segment length
- State 0: 1124499
- State 1: 680149
|
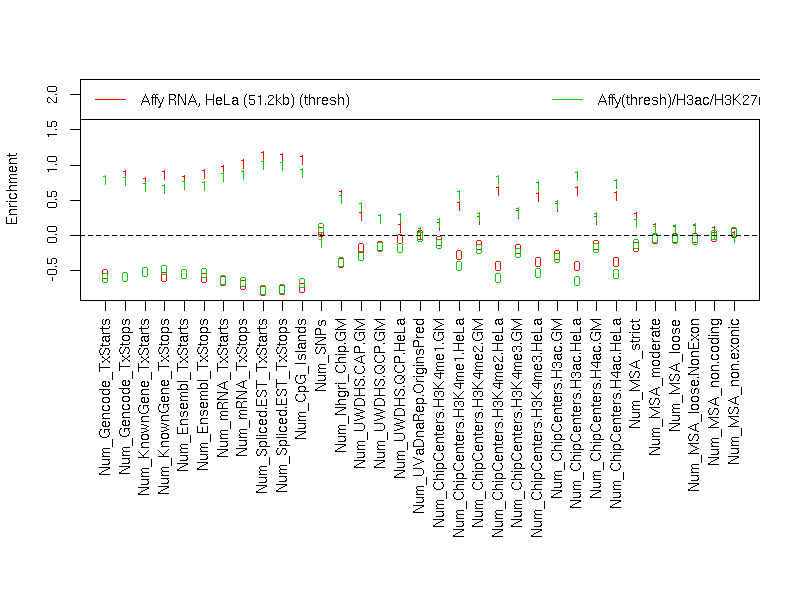
- Number of segments
- Total size (bp)
- State 0: 16334939
- State 1: 12922947
- Avg. segment length
- State 0: 267786
- State 1: 243829
- Median segment length
- State 0: 175999
- State 1: 140999
- Min. segment length
- State 0: 16999
- State 1: 3999
- Max. segment length
- State 0: 1116999
- State 1: 1099999
|