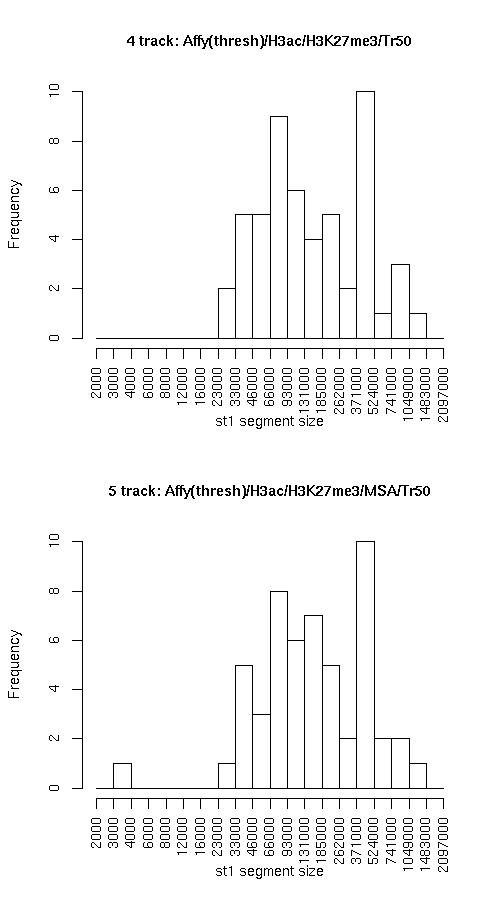
Compare segmentations, 4 track: Affy(thresh)/H3ac/H3K27me3/Tr50 vs. 5 track: Affy(thresh)/H3ac/H3K27me3/MSA/Tr50

Histogram of active state (st1) segment lengths

Individual segmentation statistics

4 track: Affy(thresh)/H3ac/H3K27me3/Tr50 5 track: Affy(thresh)/H3ac/H3K27me3/MSA/Tr50
  • Number of segments
    • State 0: 62
    • State 1: 53
  • Total size (bp)
    • State 0: 16320938
    • State 1: 12936947
  • Avg. segment length
    • State 0: 263241
    • State 1: 244093
  • Median segment length
    • State 0: 188999
    • State 1: 130999
  • Min. segment length
    • State 0: 16999
    • State 1: 27999
  • Max. segment length
    • State 0: 1117999
    • State 1: 1094999
  • Number of segments
    • State 0: 61
    • State 1: 53
  • Total size (bp)
    • State 0: 16334939
    • State 1: 12922947
  • Avg. segment length
    • State 0: 267786
    • State 1: 243829
  • Median segment length
    • State 0: 175999
    • State 1: 140999
  • Min. segment length
    • State 0: 16999
    • State 1: 3999
  • Max. segment length
    • State 0: 1116999
    • State 1: 1099999

Intersection

st0 st1 total
Total bp 16099939 12701947 28801886
Fraction of Affy.H3ac.H3K27me3.Tr50 0.9864592 0.981835 0.9844145
Fraction of Affy.H3ac.H3K27me3.MSA.Tr50 0.9856137 0.9828986 0.9844145

Affy.H3ac.H3K27me3.Tr50 minus Affy.H3ac.H3K27me3.MSA.Tr50

st0 st1 total
Total bp 220999 235000 455999
Fraction of Affy.H3ac.H3K27me3.Tr50 0.01354083 0.01816503 0.01558551
Fraction of Affy.H3ac.H3K27me3.MSA.Tr50 0.01352922 0.01818471 0.01558551

Affy.H3ac.H3K27me3.MSA.Tr50 minus Affy.H3ac.H3K27me3.Tr50

st0 st1 both
Total bp 235000 221000 456000
Fraction of Affy.H3ac.H3K27me3.Tr50 0.01439868 0.01708286 0.01558554
Fraction of Affy.H3ac.H3K27me3.MSA.Tr50 0.01438634 0.01710136 0.01558554

Symmetric difference

st0 st1
Total bp 455999 456000
Fraction of Affy.H3ac.H3K27me3.Tr50 0.02793951 0.03524788
Fraction of Affy.H3ac.H3K27me3.MSA.Tr50 0.02791556 0.03528607

Enrichment of elements

Plots below indicate the relative enrichment, over the expected value, of various elements in each state, for each dataset. Enrichment values for state 0 are represented with "0"s and "1"s for state 1. Different colors are used for the different datasets.