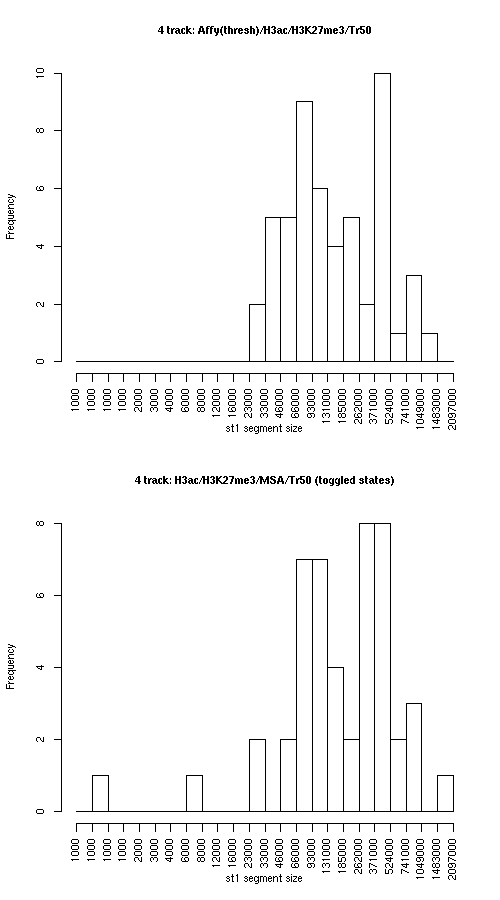
Compare segmentations, 4 track: Affy(thresh)/H3ac/H3K27me3/Tr50 vs. 4 track: H3ac/H3K27me3/MSA/Tr50 (toggled states)

Histogram of active state (st1) segment lengths

Individual segmentation statistics

4 track: Affy(thresh)/H3ac/H3K27me3/Tr50 4 track: H3ac/H3K27me3/MSA/Tr50 (toggled states)
  • Number of segments
    • State 0: 62
    • State 1: 53
  • Total size (bp)
    • State 0: 16320938
    • State 1: 12936947
  • Avg. segment length
    • State 0: 263241
    • State 1: 244093
  • Median segment length
    • State 0: 188999
    • State 1: 130999
  • Min. segment length
    • State 0: 16999
    • State 1: 27999
  • Max. segment length
    • State 0: 1117999
    • State 1: 1094999
  • Number of segments
    • State 0: 52
    • State 1: 48
  • Total size (bp)
    • State 0: 14768948
    • State 1: 14488952
  • Avg. segment length
    • State 0: 284018
    • State 1: 301853
  • Median segment length
    • State 0: 230999
    • State 1: 198999
  • Min. segment length
    • State 0: 21999
    • State 1: 999
  • Max. segment length
    • State 0: 1160999
    • State 1: 1593999

Intersection

st0 st1 total
Total bp 12378944 10546955 22925899
Fraction of Affy.thresh.H3ac.H3K27me3.Tr50 0.7584701 0.8152584 0.7835802
Fraction of H3ac.H3K27me3.MSA.Tr50 0.8381737 0.7279308 0.7835798

Affy.thresh.H3ac.H3K27me3.Tr50 minus H3ac.H3K27me3.MSA.Tr50

st0 st1 total
Total bp 3941994 2389992 6331986
Fraction of Affy.thresh.H3ac.H3K27me3.Tr50 0.2415299 0.1847416 0.2164198
Fraction of H3ac.H3K27me3.MSA.Tr50 0.2669110 0.1649527 0.2164197

H3ac.H3K27me3.MSA.Tr50 minus Affy.thresh.H3ac.H3K27me3.Tr50

st0 st1 both
Total bp 2390004 3941997 6332001
Fraction of Affy.thresh.H3ac.H3K27me3.Tr50 0.1464379 0.3047084 0.2164203
Fraction of H3ac.H3K27me3.MSA.Tr50 0.1618263 0.2720692 0.2164202

Symmetric difference

st0 st1
Total bp 6331998 6331989
Fraction of Affy.thresh.H3ac.H3K27me3.Tr50 0.3879678 0.48945
Fraction of H3ac.H3K27me3.MSA.Tr50 0.4287372 0.4370219

Enrichment of elements

Plots below indicate the relative enrichment, over the expected value, of various elements in each state, for each dataset. Enrichment values for state 0 are represented with "0"s and "1"s for state 1. Different colors are used for the different datasets.