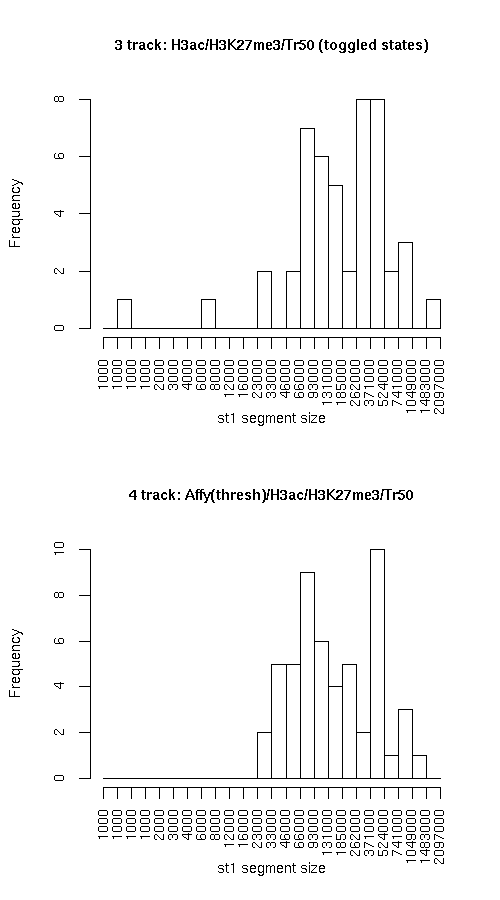
Compare segmentations, 3 track: H3ac/H3K27me3/Tr50 (toggled states) vs. 4 track: Affy(thresh)/H3ac/H3K27me3/Tr50

Histogram of active state (st1) segment lengths

Individual segmentation statistics

3 track: H3ac/H3K27me3/Tr50 (toggled states) 4 track: Affy(thresh)/H3ac/H3K27me3/Tr50
  • Number of segments
    • State 0: 52
    • State 1: 48
  • Total size (bp)
    • State 0: 14759948
    • State 1: 14497952
  • Avg. segment length
    • State 0: 283845
    • State 1: 302041
  • Median segment length
    • State 0: 230999
    • State 1: 199999
  • Min. segment length
    • State 0: 21999
    • State 1: 999
  • Max. segment length
    • State 0: 1160999
    • State 1: 1593999
  • Number of segments
    • State 0: 62
    • State 1: 53
  • Total size (bp)
    • State 0: 16320938
    • State 1: 12936947
  • Avg. segment length
    • State 0: 263241
    • State 1: 244093
  • Median segment length
    • State 0: 188999
    • State 1: 130999
  • Min. segment length
    • State 0: 16999
    • State 1: 27999
  • Max. segment length
    • State 0: 1117999
    • State 1: 1094999

Intersection

st0 st1 total
Total bp 12368944 10545955 22914899
Fraction of H3ac.H3K27me3.Tr50 0.8380073 0.72741 0.7832038
Fraction of Affy.thresh.H3ac.H3K27me3.Tr50 0.7578574 0.8151811 0.7832042

H3ac.H3K27me3.Tr50 minus Affy.thresh.H3ac.H3K27me3.Tr50

st0 st1 total
Total bp 2391004 3951997 6343001
Fraction of H3ac.H3K27me3.Tr50 0.1619927 0.27259 0.2167962
Fraction of Affy.thresh.H3ac.H3K27me3.Tr50 0.1464992 0.3054814 0.2167963

Affy.thresh.H3ac.H3K27me3.Tr50 minus H3ac.H3K27me3.Tr50

st0 st1 both
Total bp 3951994 2390992 6342986
Fraction of H3ac.H3K27me3.Tr50 0.2677512 0.1649193 0.2167957
Fraction of Affy.thresh.H3ac.H3K27me3.Tr50 0.2421426 0.1848189 0.2167958

Symmetric difference

st0 st1
Total bp 6342998 6342989
Fraction of H3ac.H3K27me3.Tr50 0.4297439 0.4375093
Fraction of Affy.thresh.H3ac.H3K27me3.Tr50 0.3886418 0.4903003

Enrichment of elements

Plots below indicate the relative enrichment, over the expected value, of various elements in each state, for each dataset. Enrichment values for state 0 are represented with "0"s and "1"s for state 1. Different colors are used for the different datasets.